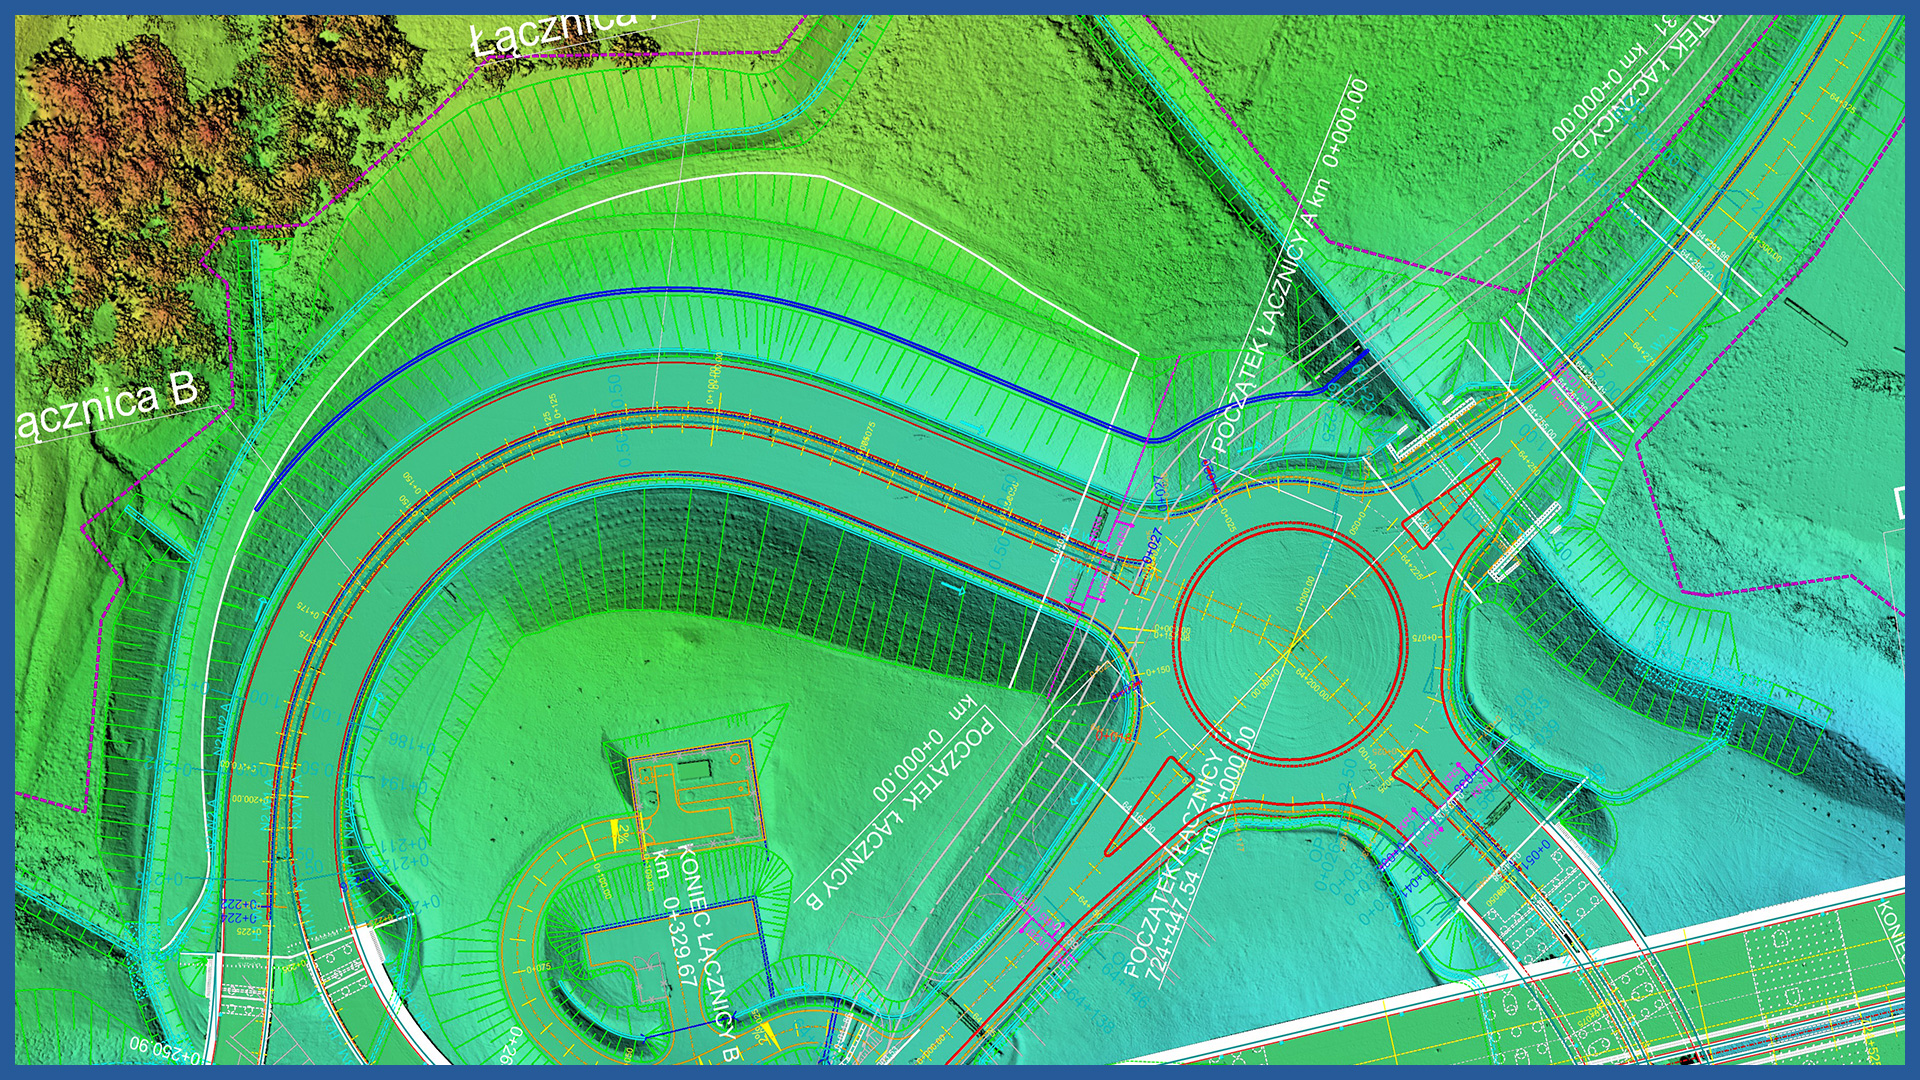
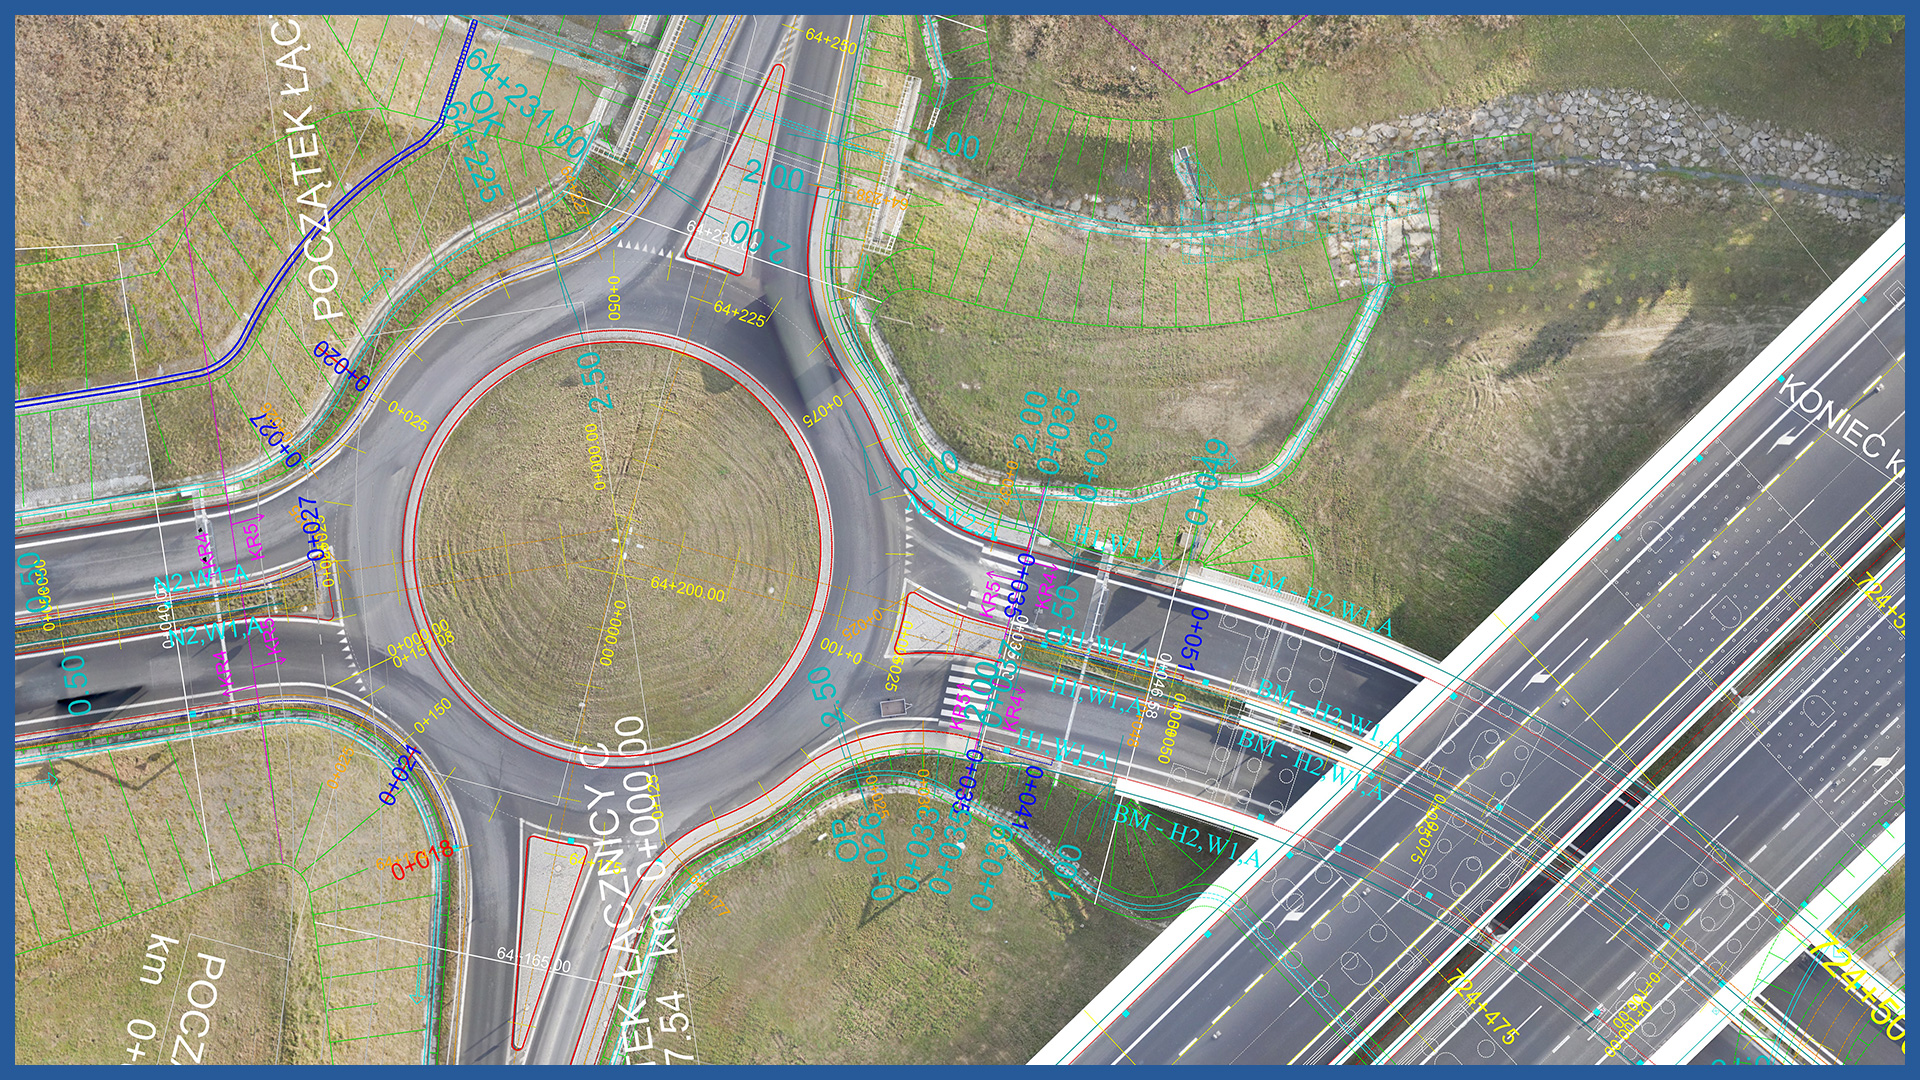
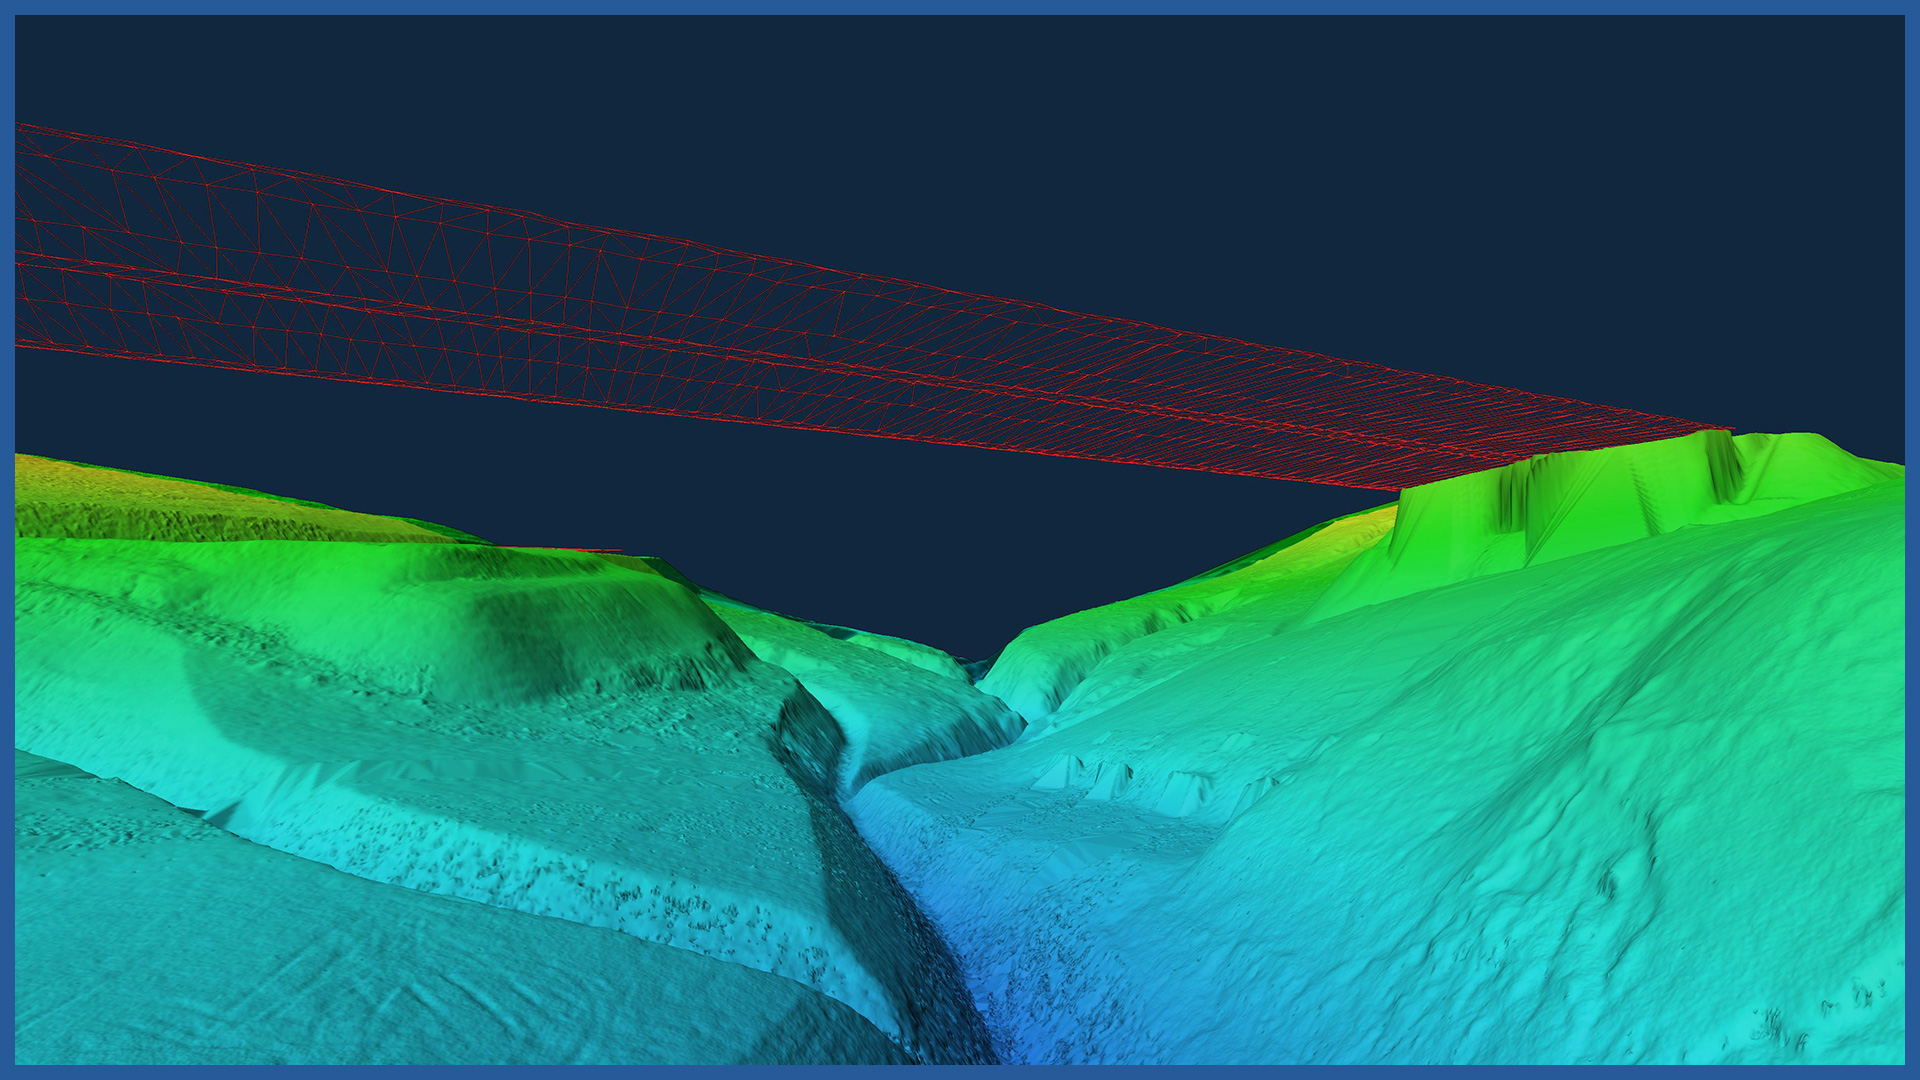
The presentation of designed investments against the background of the real environment supports the design process and agreements between the designer and the investor. It can also be used for public consultation with the parties to the proceedings.
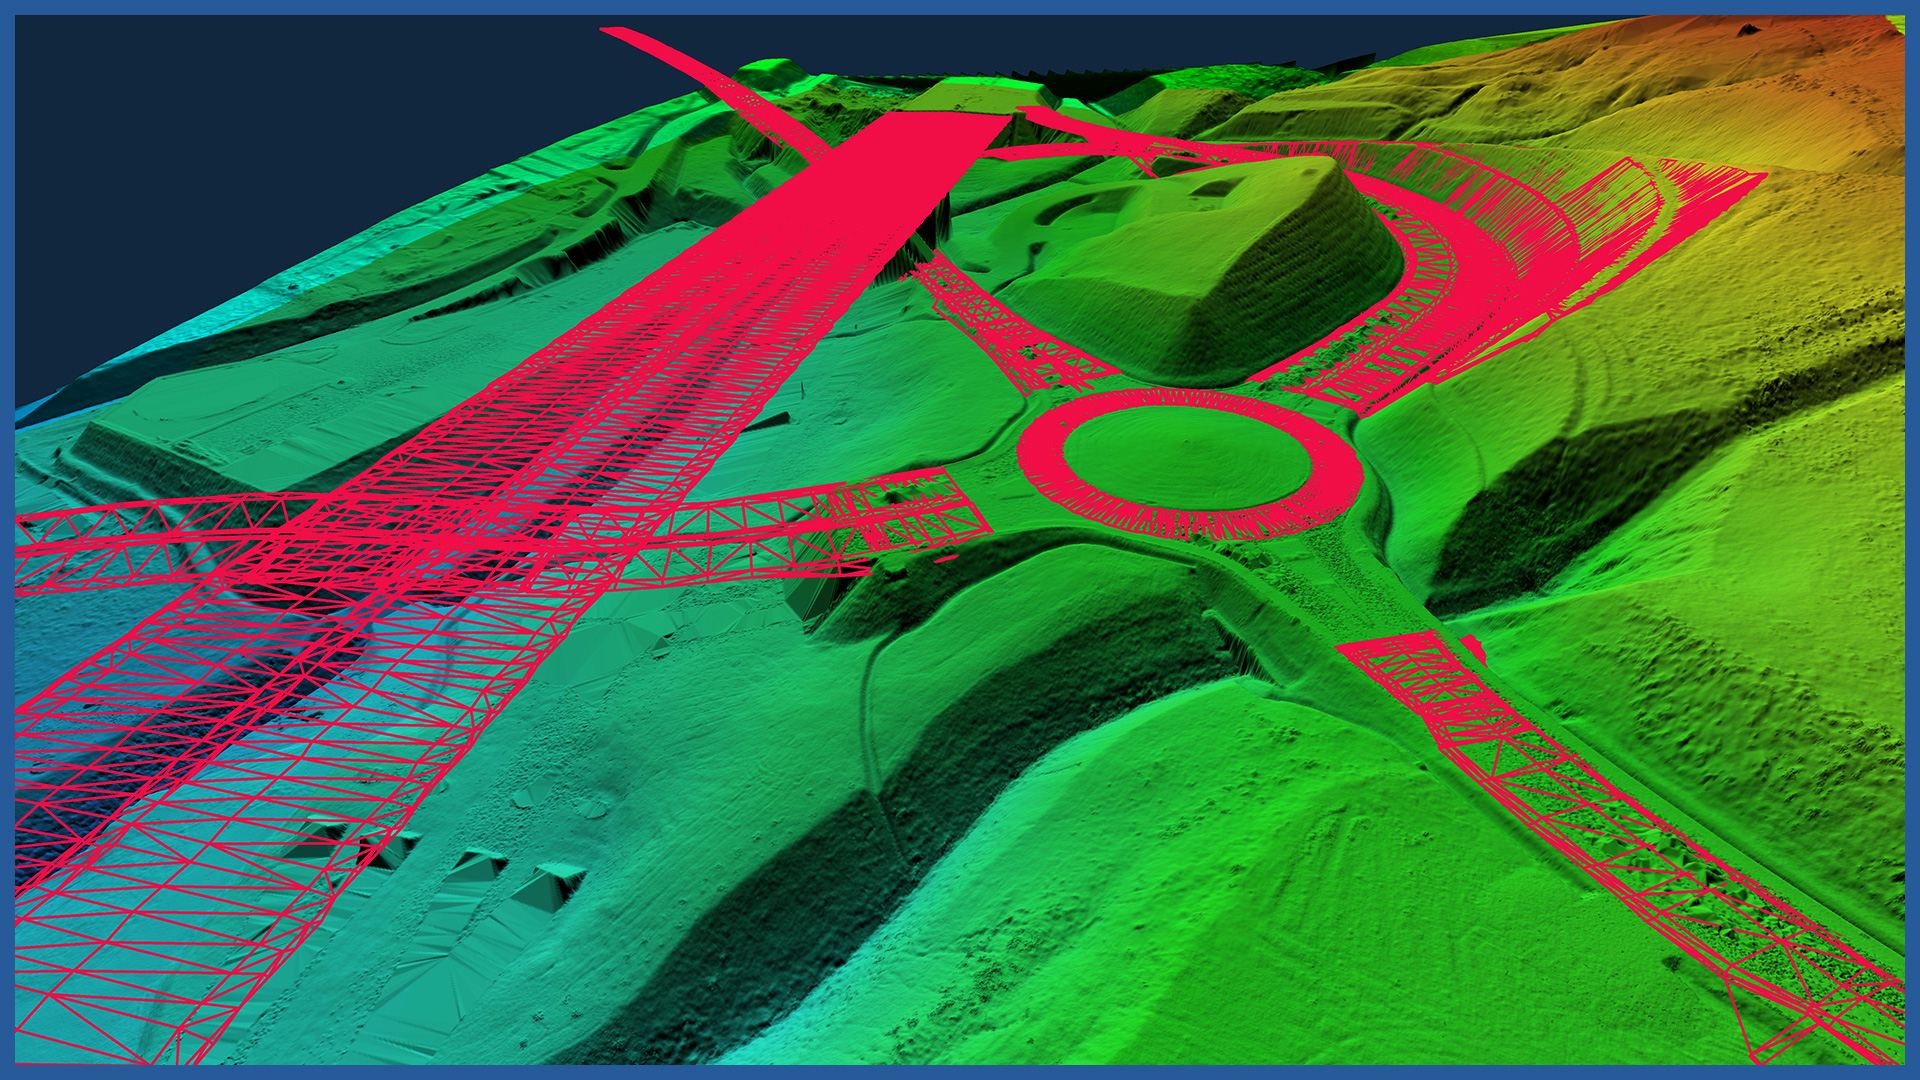
A colorful point cloud, a high-resolution orthophotomap or a photorealistic 3D model of the investment area and its surroundings is an up-to-date base for visualization of designed objects.
The documentation we produce supports the entire investment process, starting from design through implementation to completion.
We can make visualizations in 2D space (orthophotomap) and 3D (point cloud, photorealistic 3D model). Once the study is placed on a specialized platform, we provide access to authorized users, who can work with the data without the need for specialized software.
Measurements performed periodically allow to make a presentation of changes over time.
POINT CLOUD CHARACTERISTICS:
| Point cloud density (LiDAR) | ~400 pts/m2 |
| Point cloud density (photogrammetry) | ~2500 pts/m2 |
| Accuracy | <3 cm |
| Data format | LAS / LAZ / E57 / TXT |
| Color palette | RGB / monochromatic / by elevation |
| Classification | ASPRS standard |
| Coordinate System | adapted to project |
ORTHOPHOTOMAP CHARACTERISTICS:
| Data format | GeoTIFF / JPEG / PDF |
| Ground Sampling Distance | od 1 cm |
| Accuracy | <3 GSD |
| Coordinate System | adapted to project |
| Color palette | 24 bit RGB |
| Compression | LZW / JPEG |
3D MODEL CHARACTERISTICS:
| Data format | 3ds / dae / obj / tls |
| Coordinate System | adapted to project |
| Vertical Reference System | adapted to project |
| Color palette | RGB / monochromatic / by elevation |
/ OTHER FROM ROAD INFRASTRUCTURE
– periodic/cyclic measurements for groundworks control
– creating cross section and comparing with project
