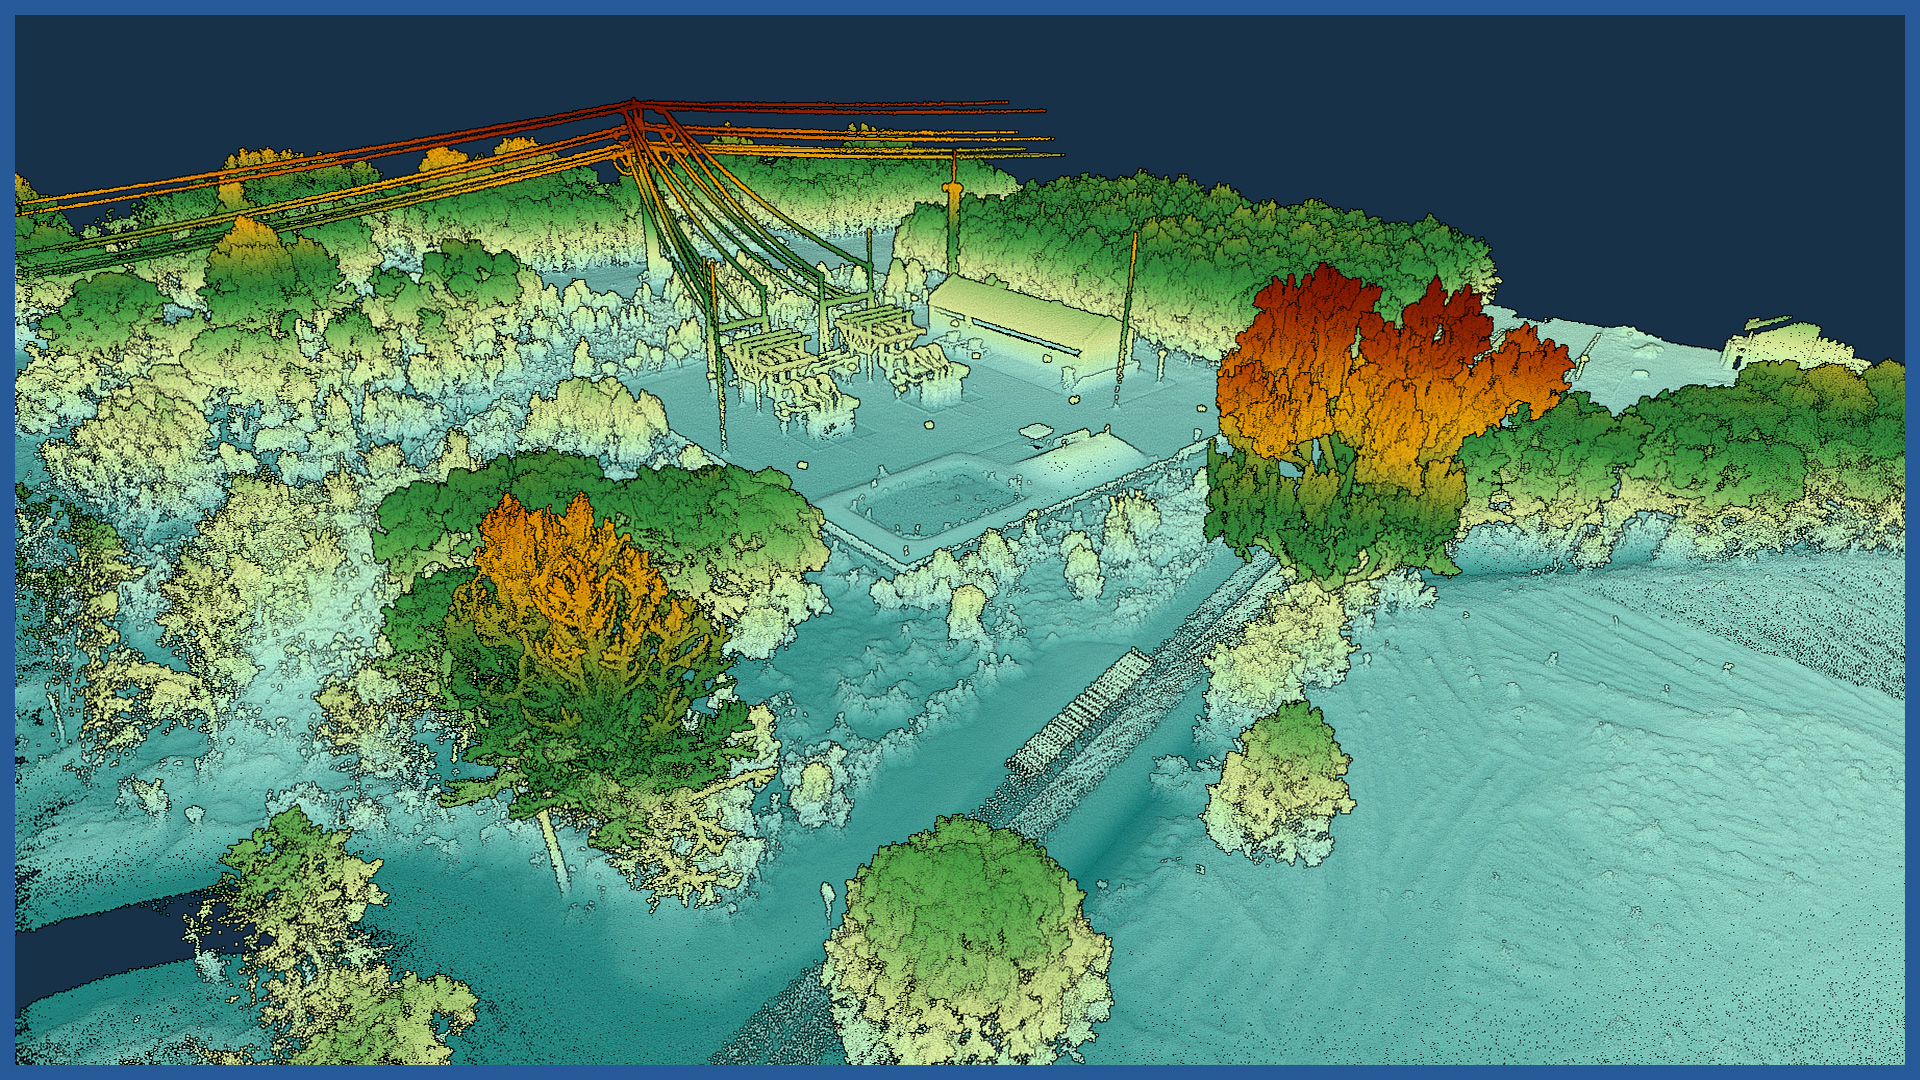
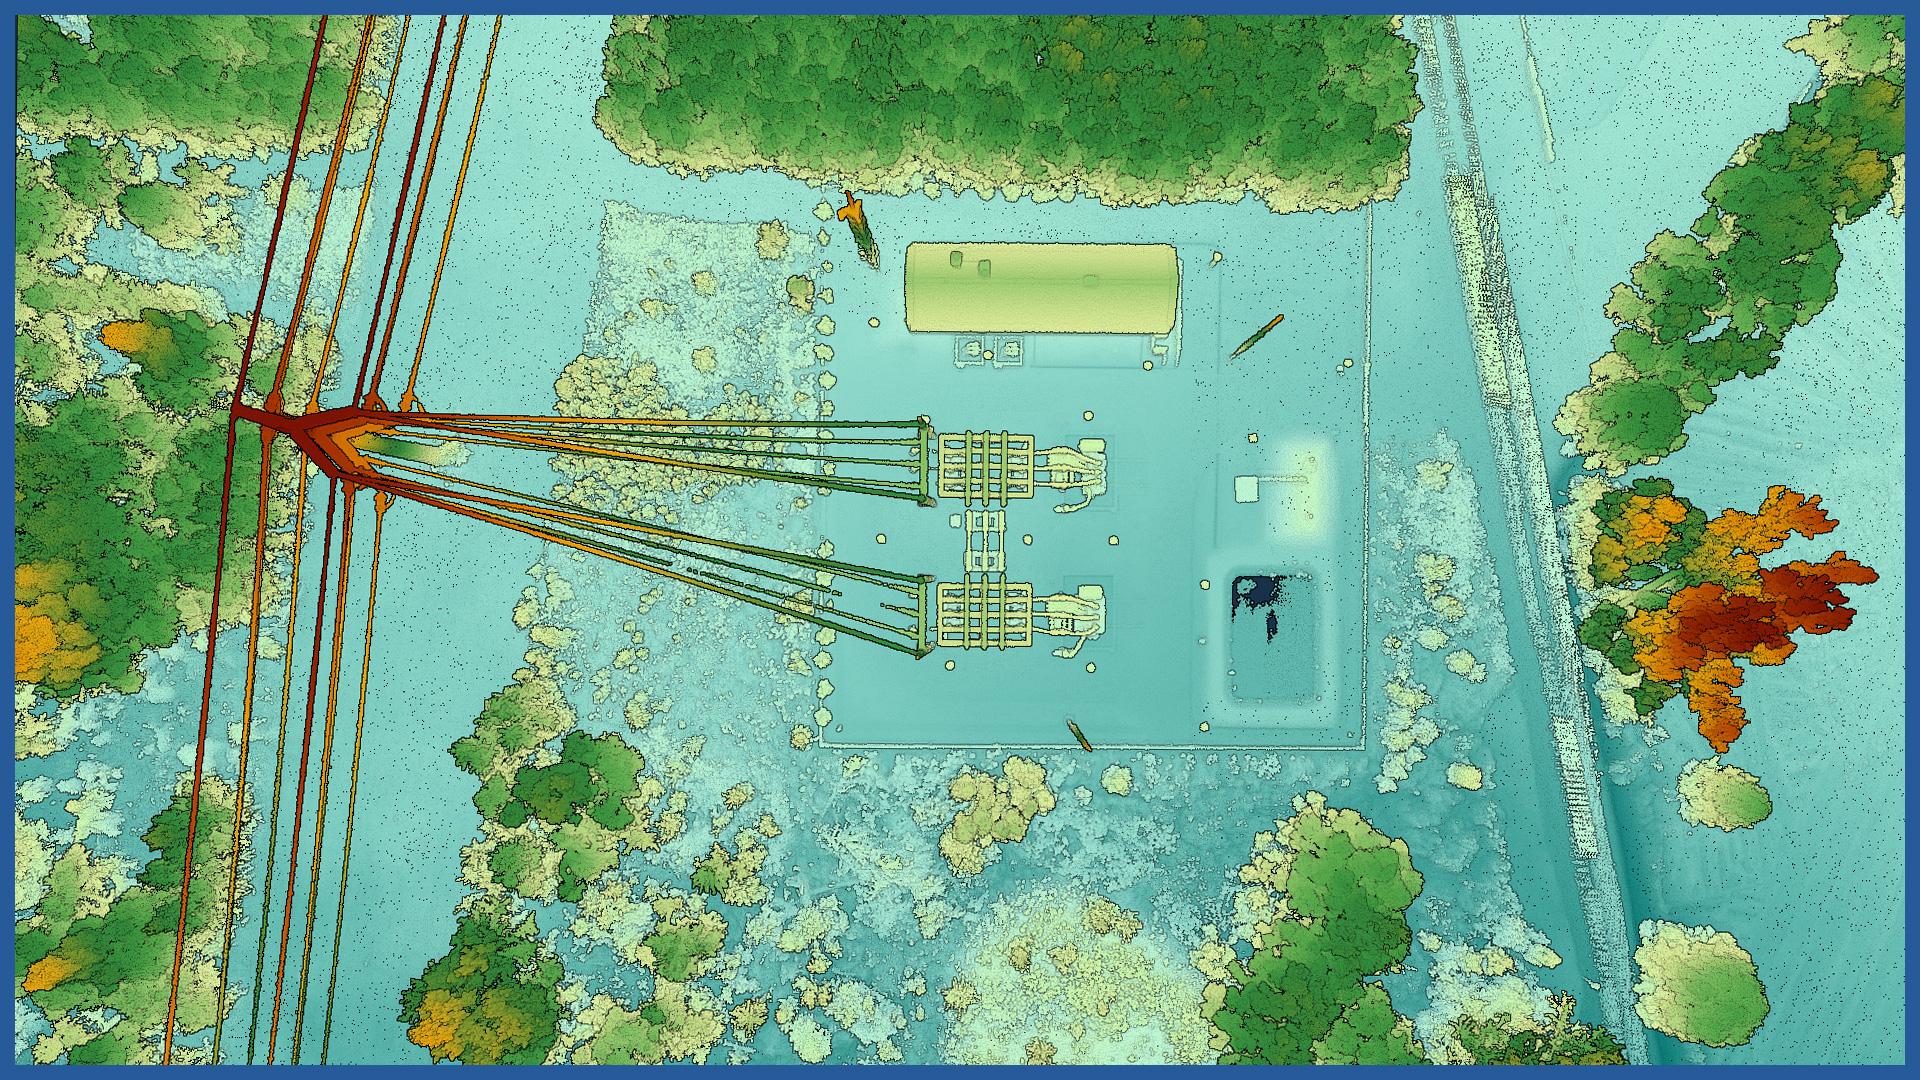
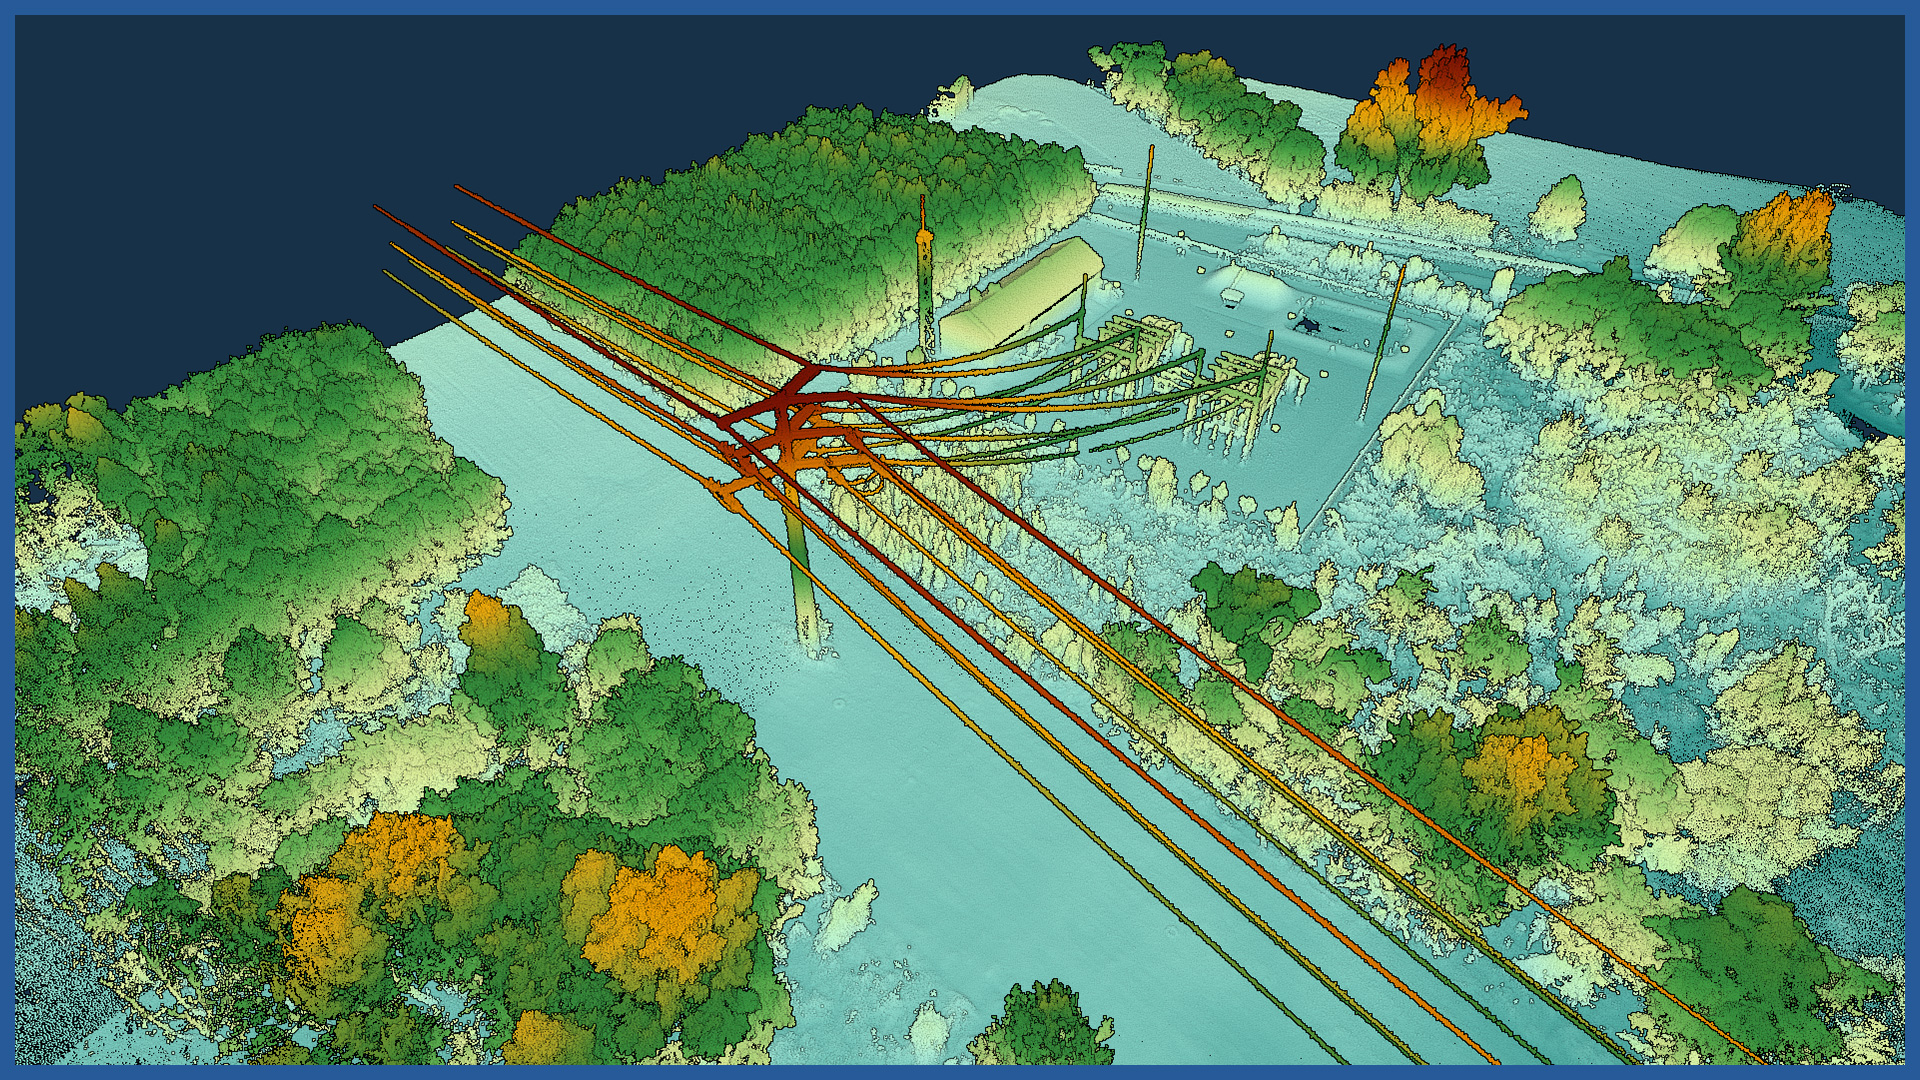
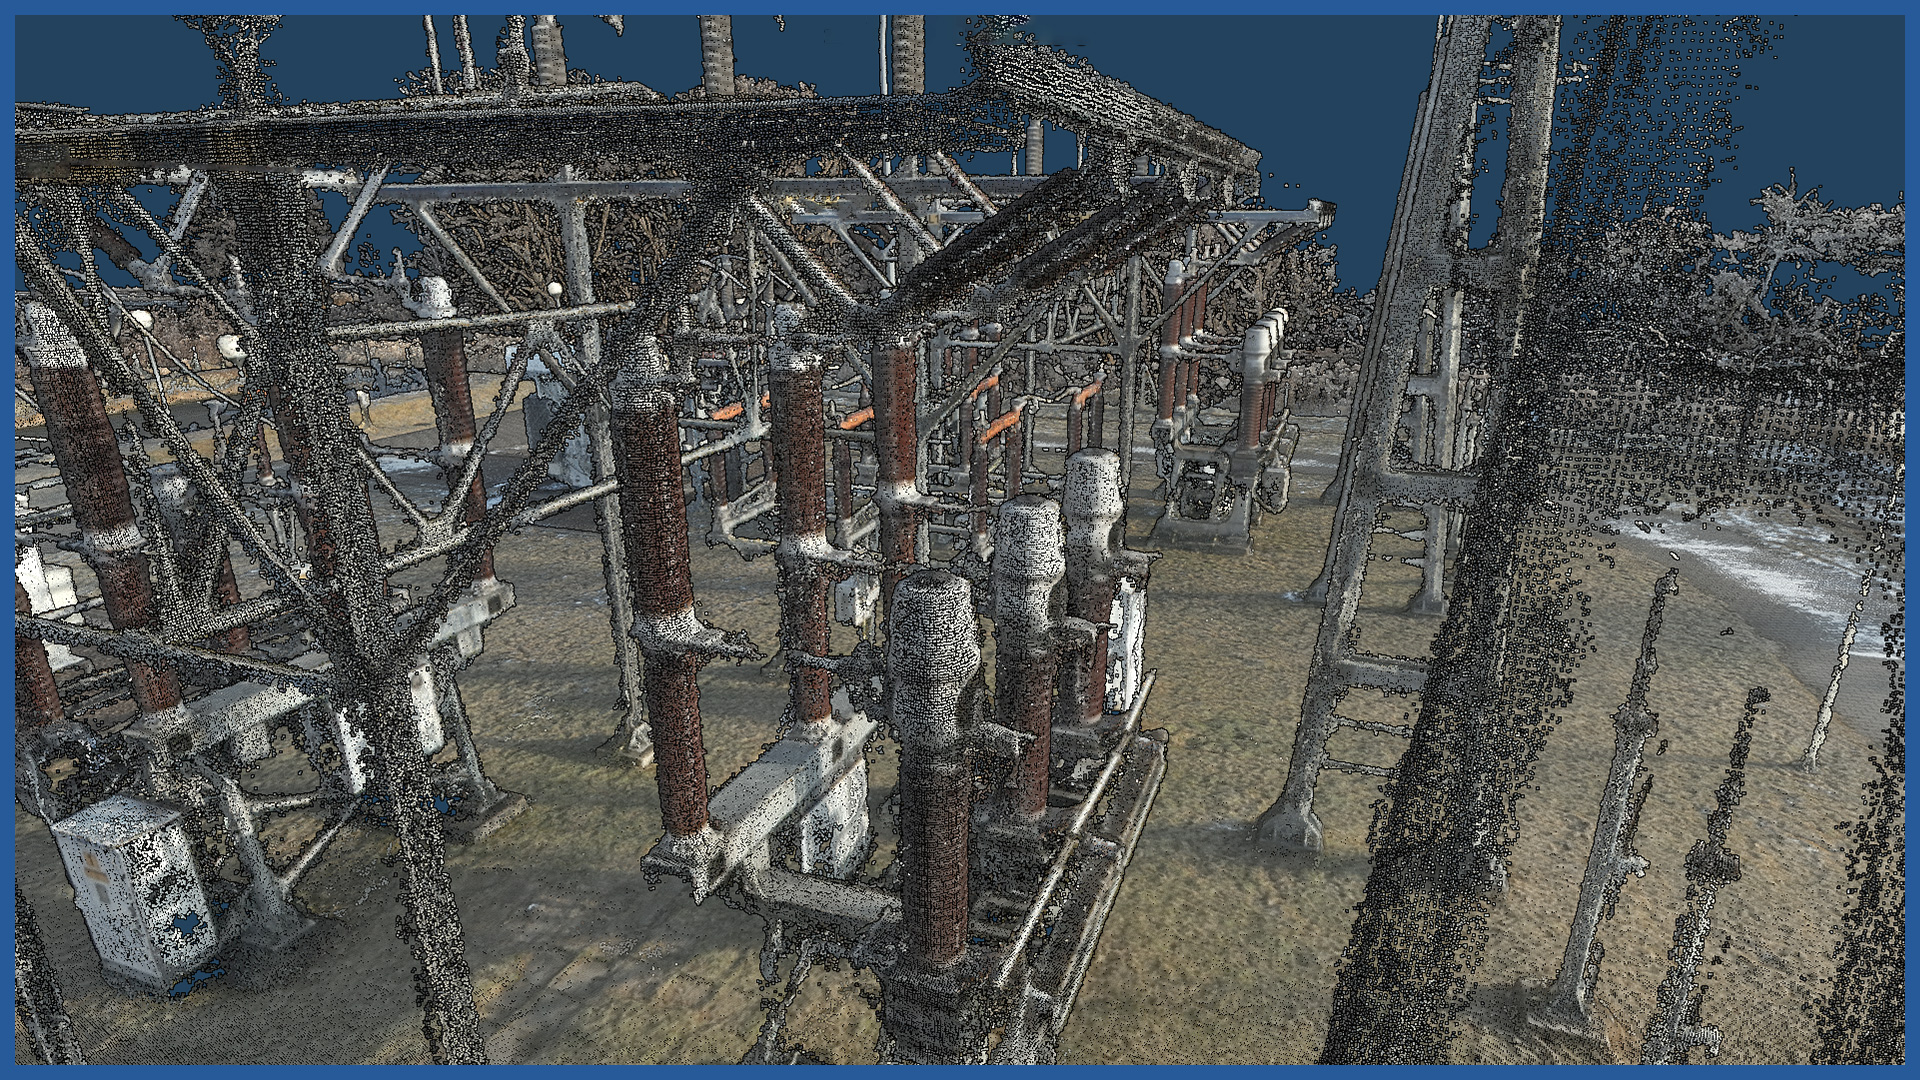
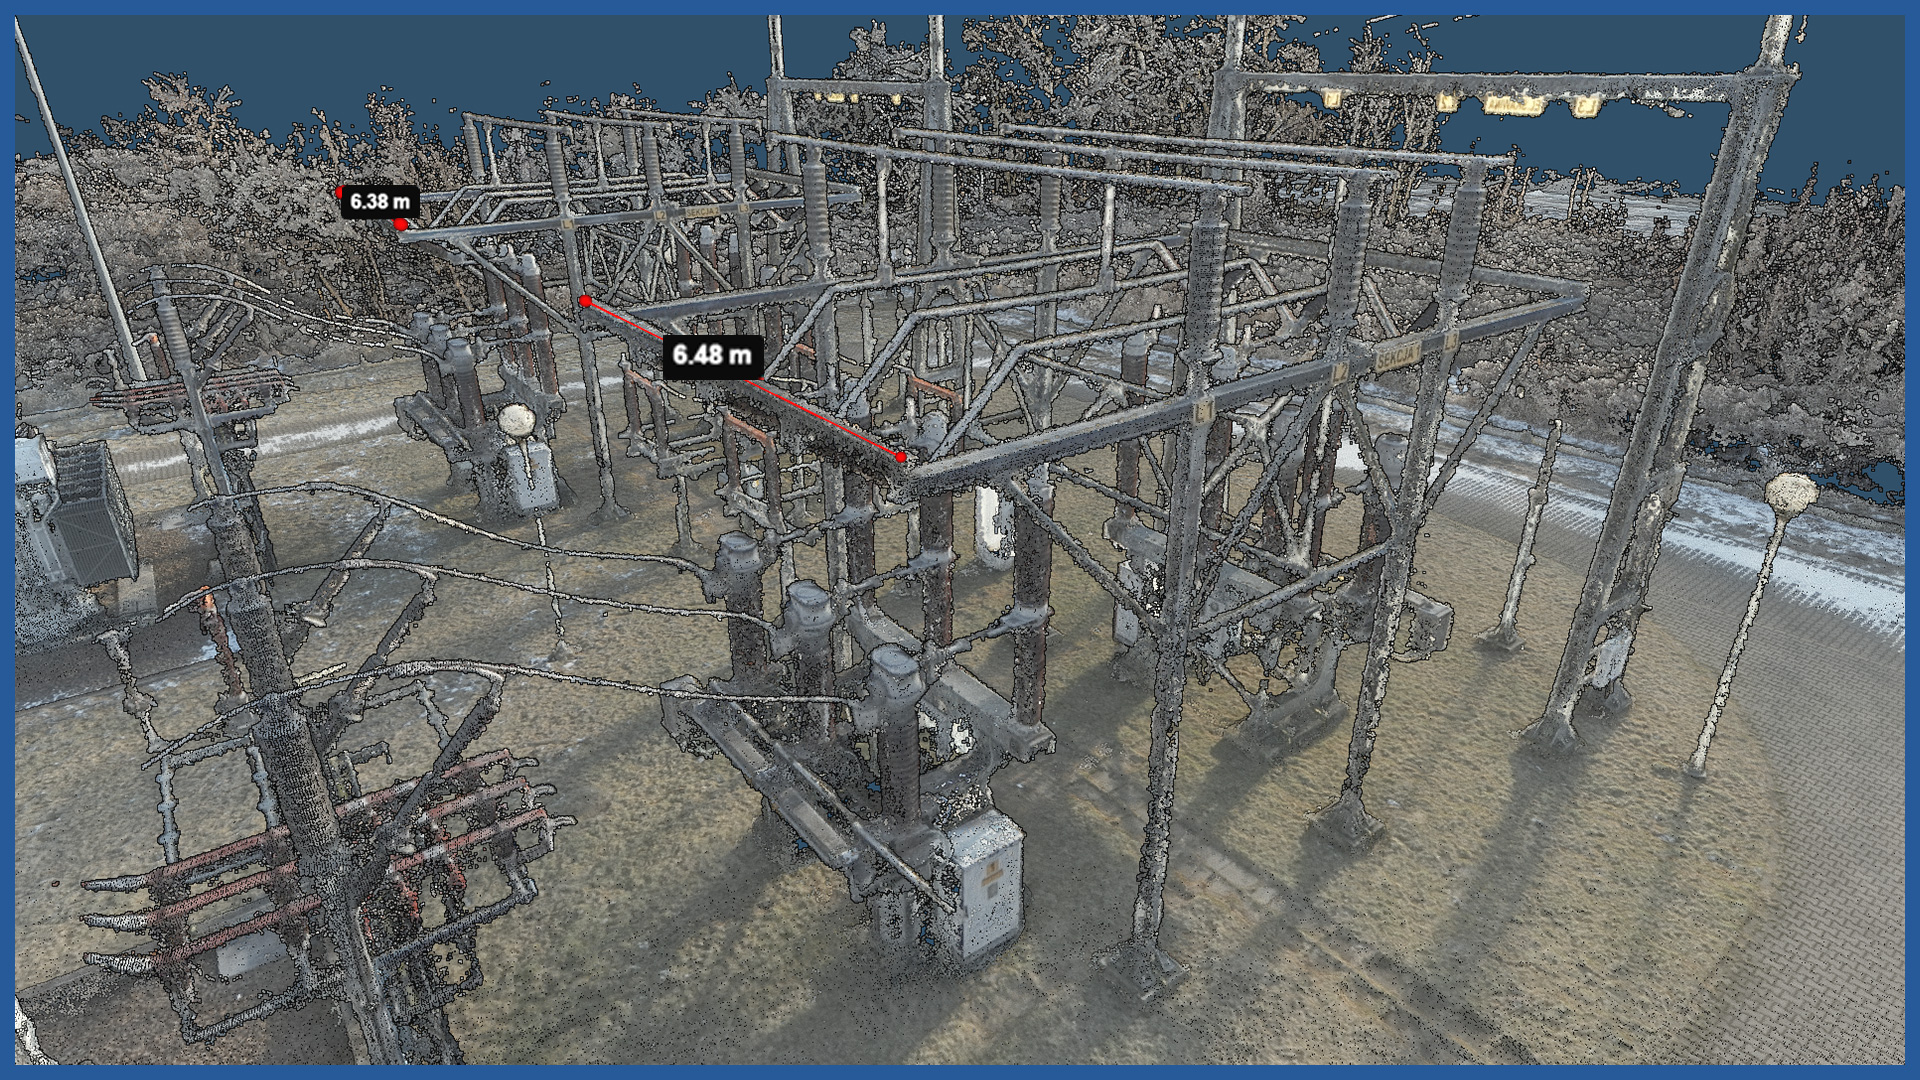
Representing a substation in 3D space using millions of colored points gives very detailed information about the facility and its surroundings.
We acquire dense point clouds by photogrammetry and airborne laser scanning. Measurement and processing are fast, we avoid generalization of measurement, and we minimize measurement errors.
Precise mapping of stations is not only the visualization of objects, but the ability to perform spatial analysis: measurements of length, distance, volume.
Dense point clouds are the basis for many studies. Most CAD programs implement this data format and allow to perform studies analyses on them.
POINT CLOUD CHARACTERISTICS:
| Point cloud density (LiDAR) | ~400 pts/m2 |
| Point cloud density (photogrammetry) | ~2500 pts/m2 |
| Accuracy | <3 cm |
| Data format | LAS / LAZ / E57 / TXT |
| Color palette | RGB / monochromatic / by elevation |
| Classification | ASPRS standard |
| Coordinate System | adapted to project |
/ OTHER FROM ENERGETICS
Power lines:
– powerlines modeling
– calculating catenary parameters
– powerlines profiles
Electricity stations / traction substations:

