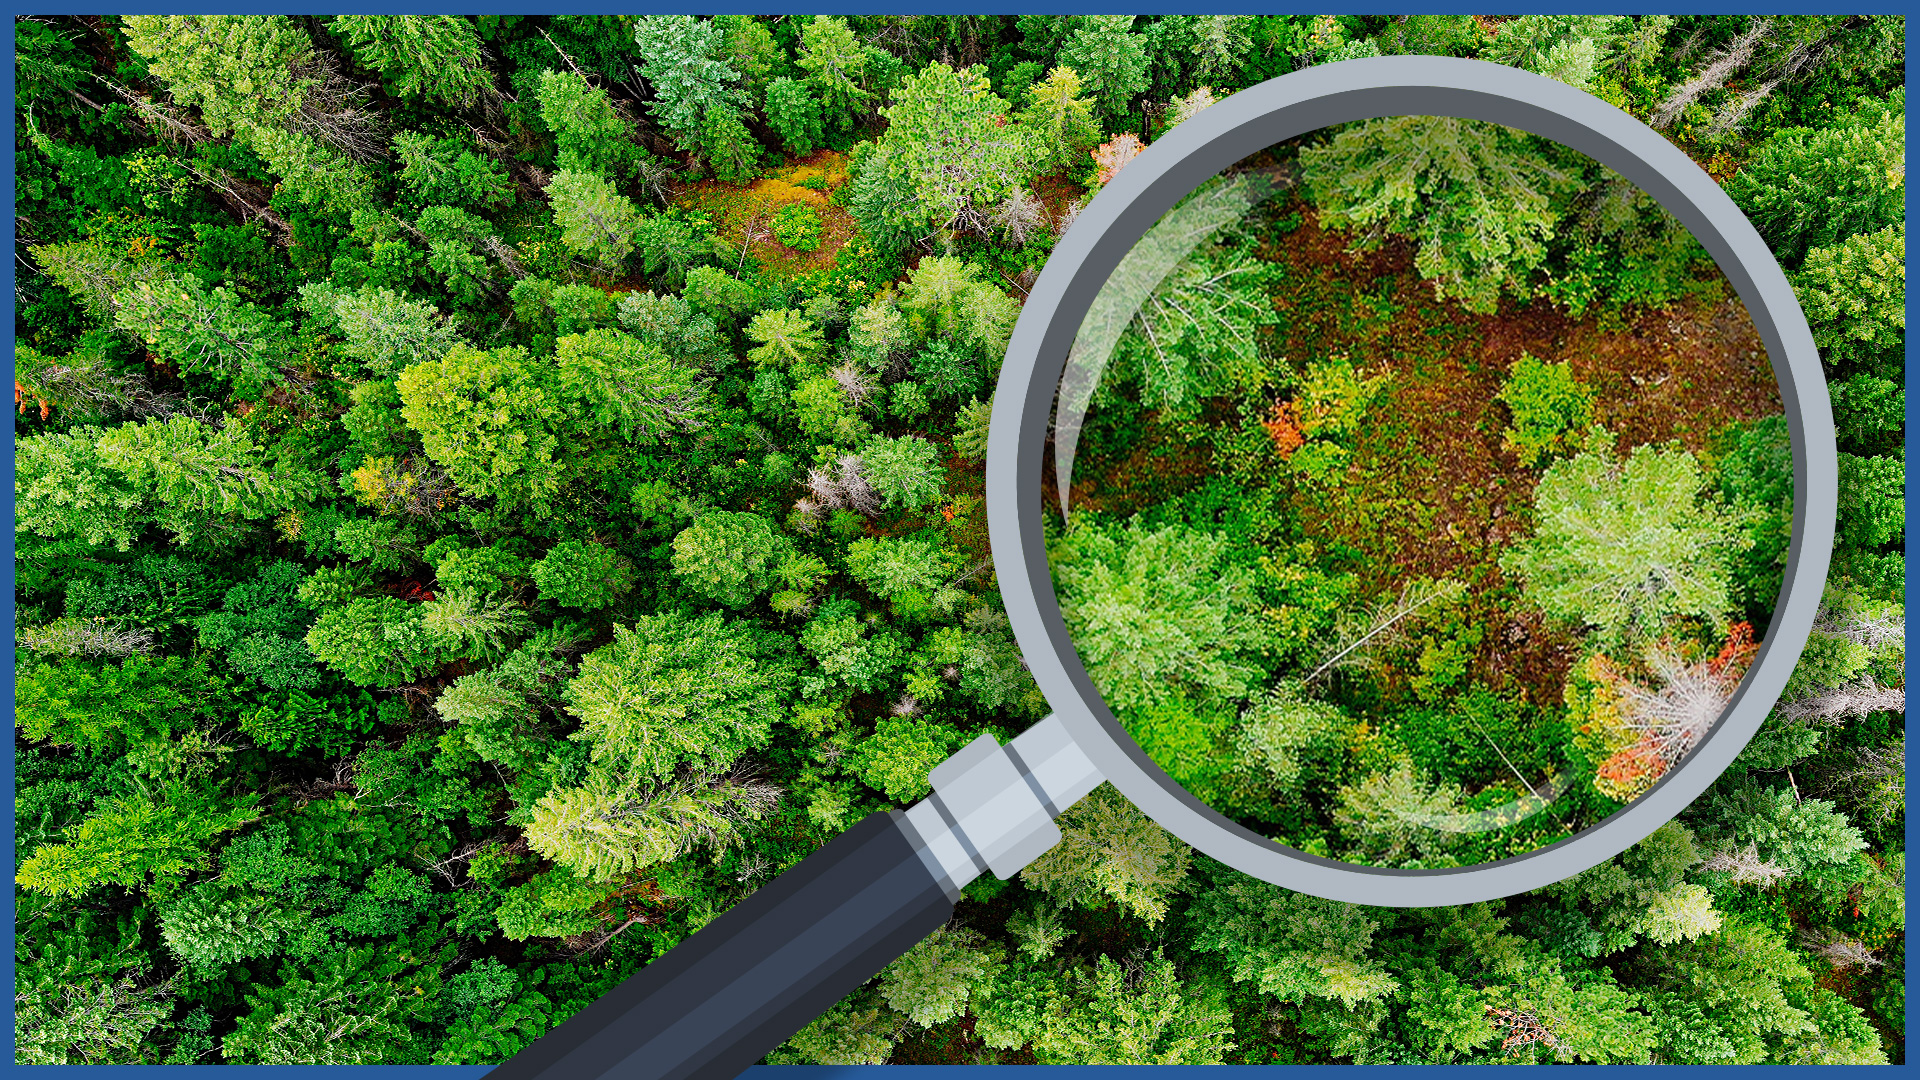
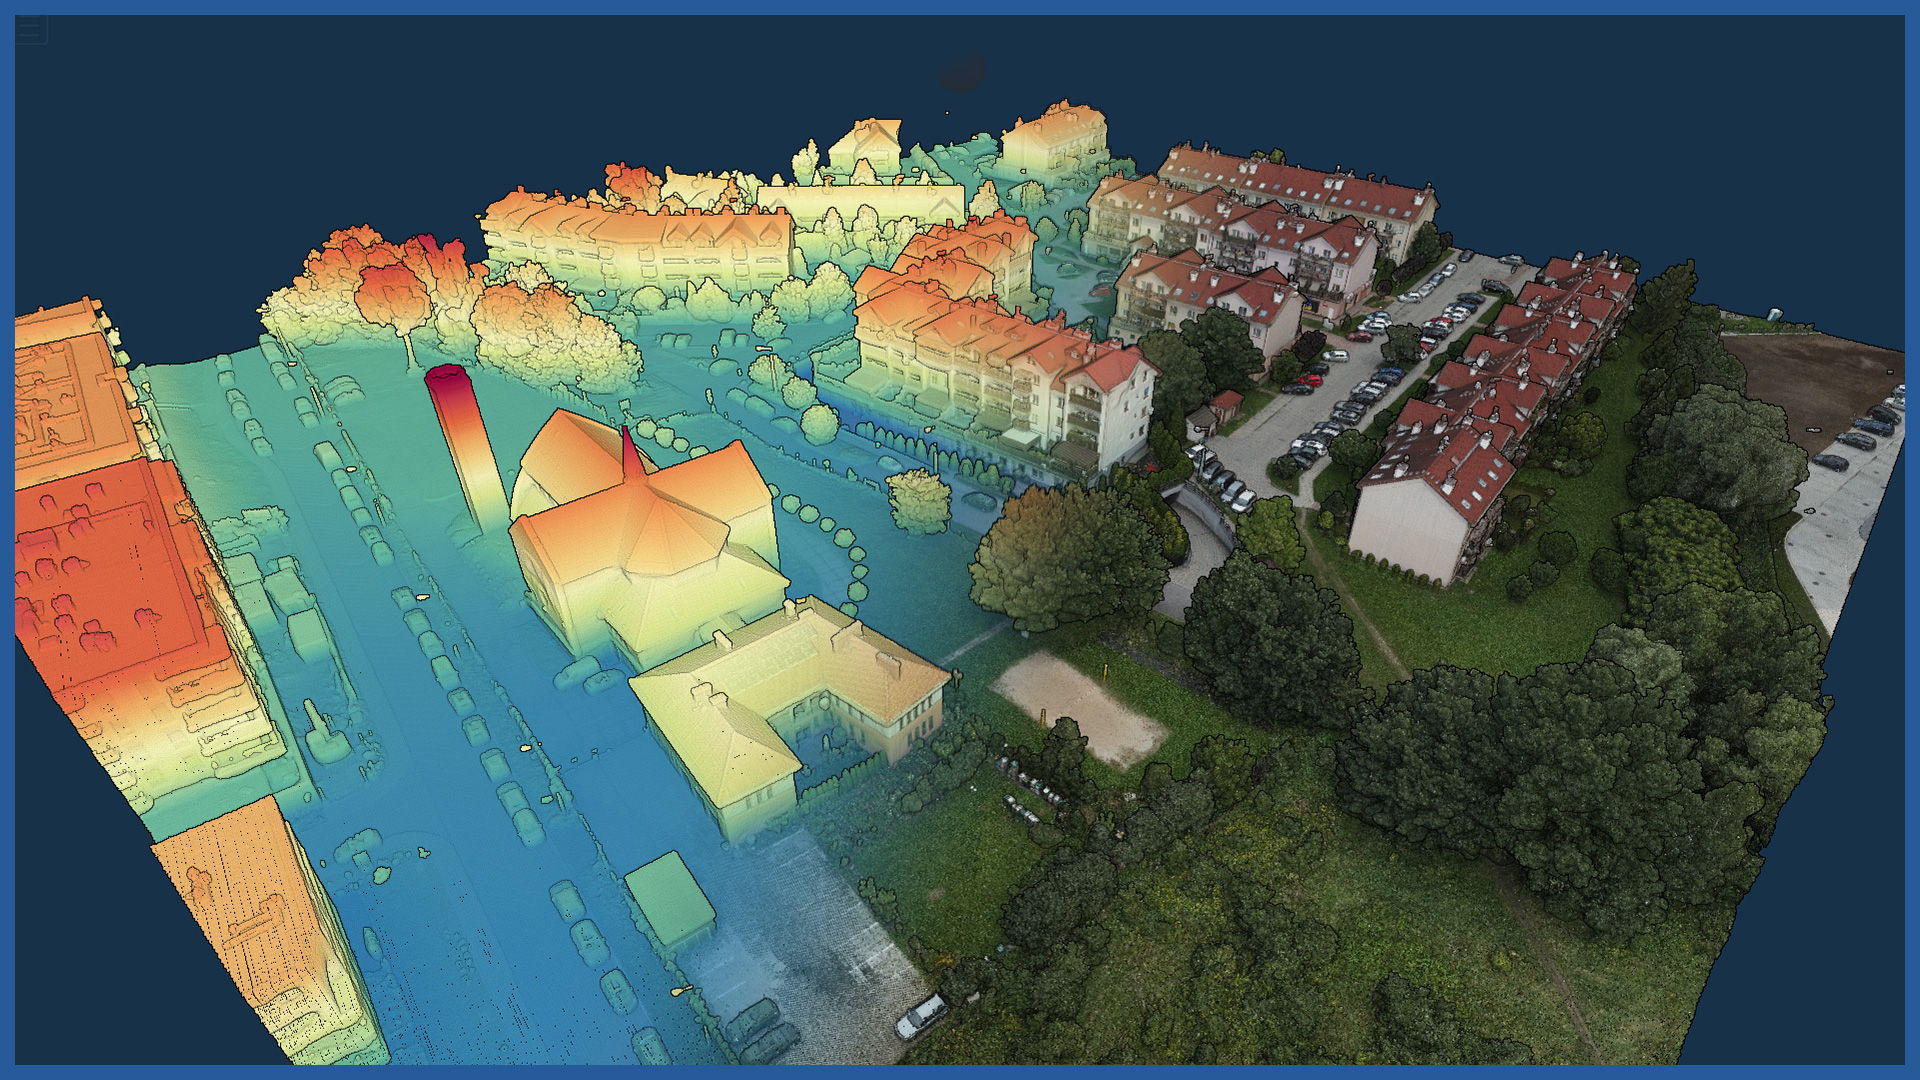
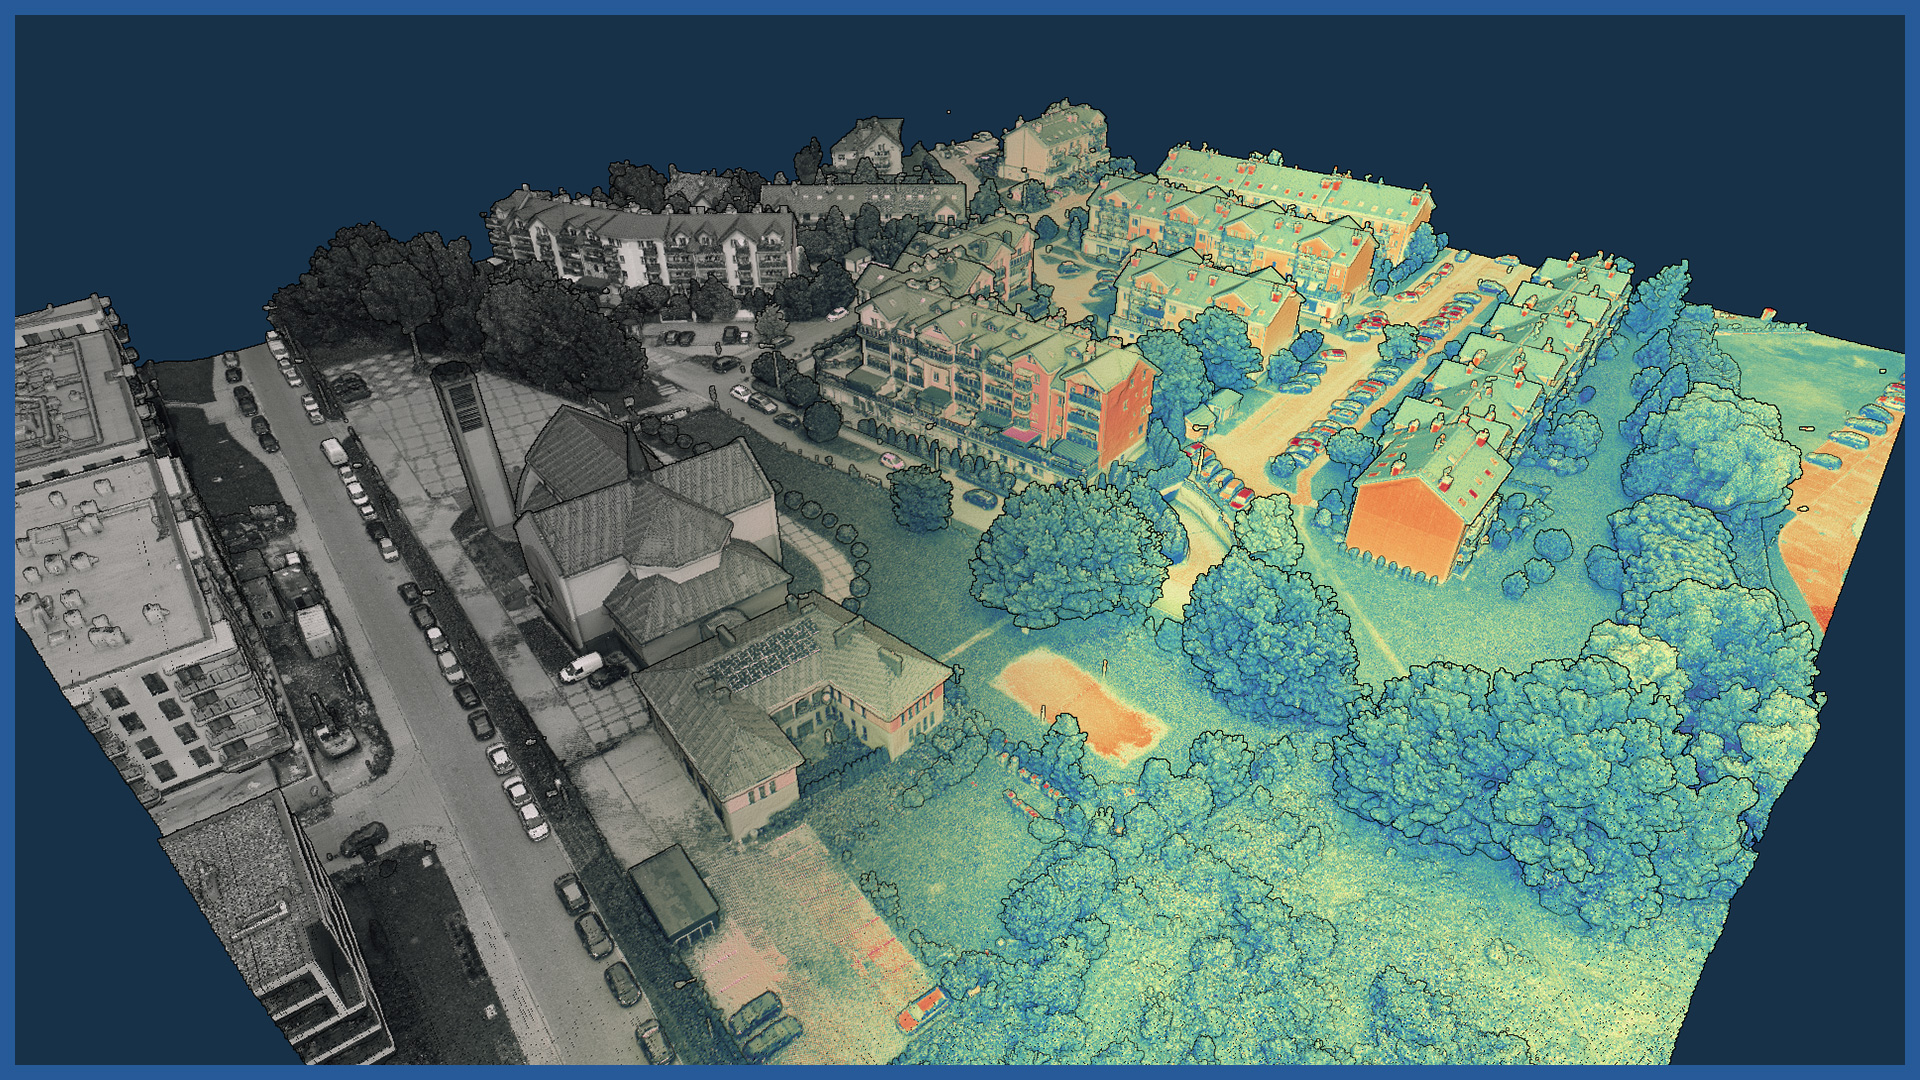
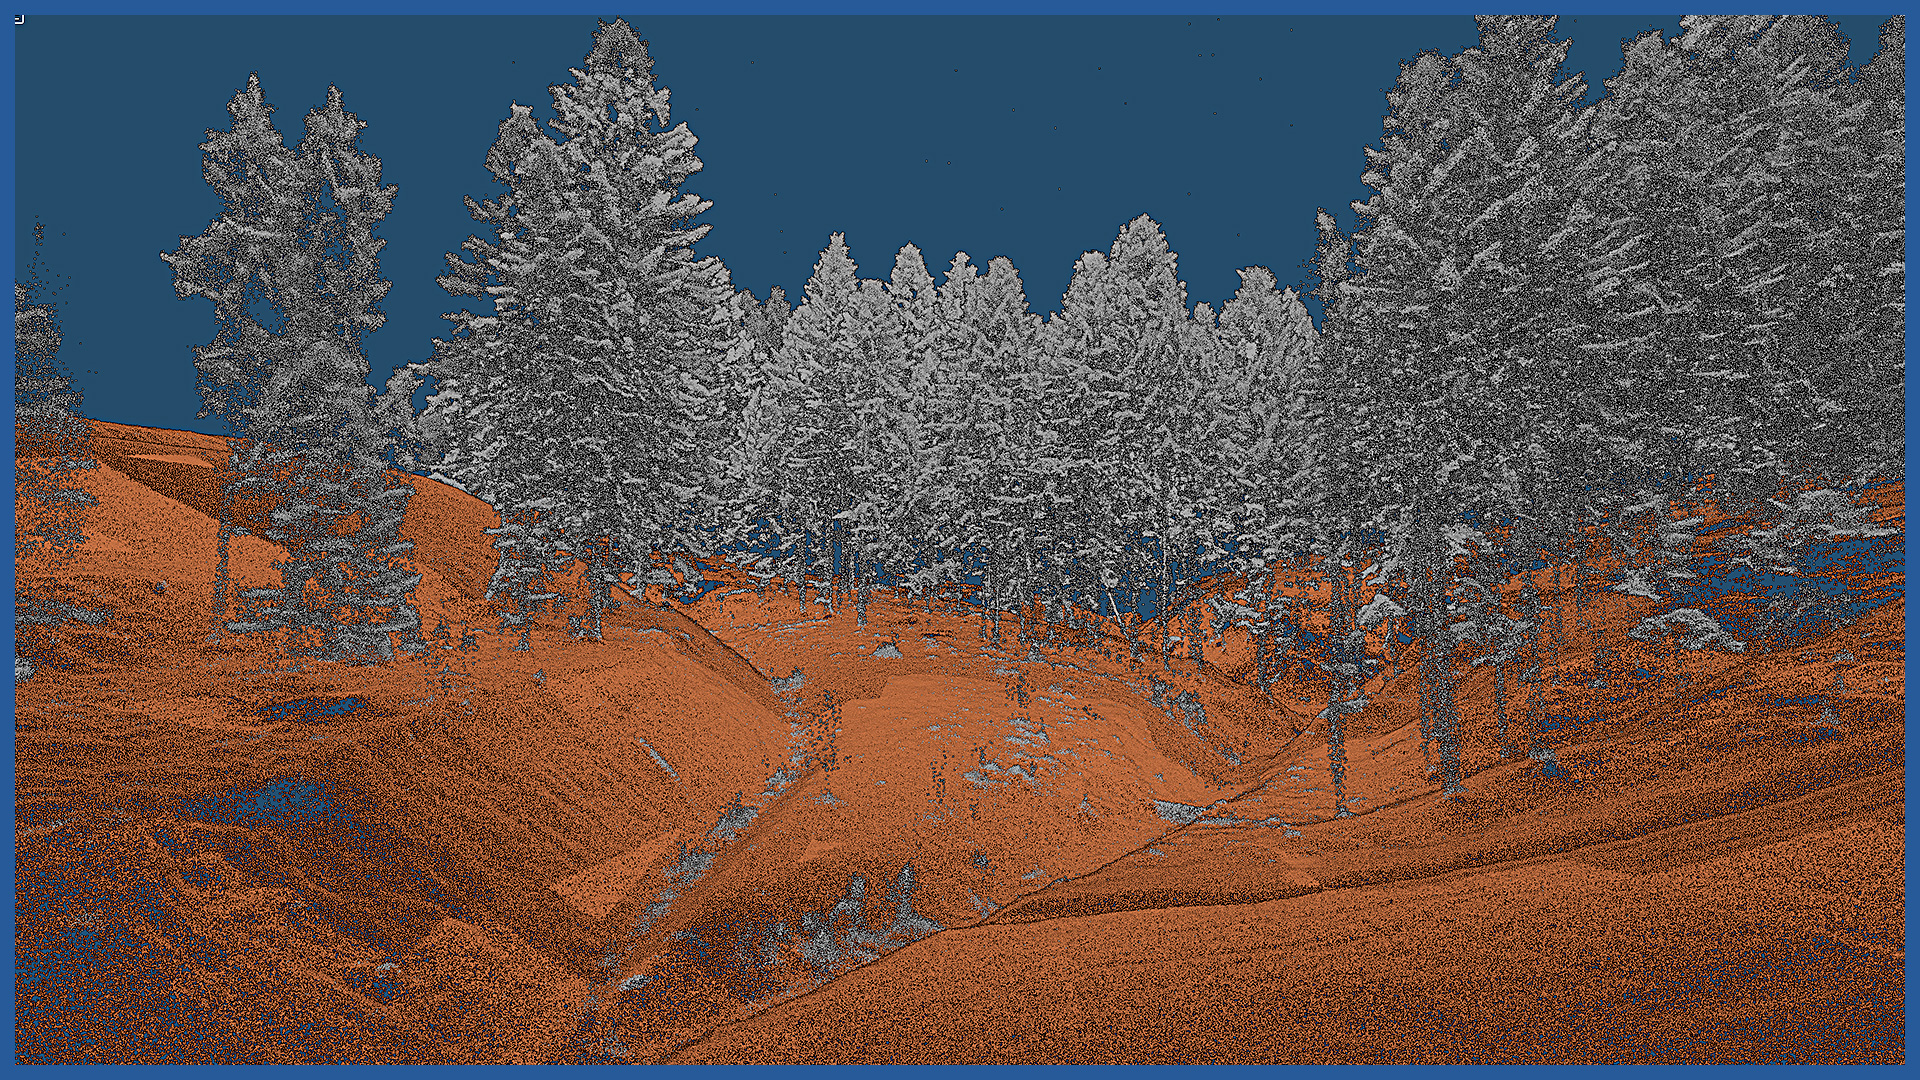
We make the map of actual vegetation on the basis of high-resolution orthophotos and airborne laser scanning.
The vegetation map is an accurate and real image of the current state of greenery. It contains a range of information about the shape of the tree crowns and the height of trees, the relief of the ground.
Laser technology allows us to quickly acquire information inside the complex to identify trees, their species, measure height and size.
The map is the basis for greenery management projects and environmental reports.
Our technology finds a number of applications:
– inventory of forest complexes
– inventory of parks and urban areas, allotment gardens
– reporting of the actual biologically active area before and after the investment
– inventory of a stand of trees, its selected features
– quantitative, area and volume summaries of forests
– assessment of the condition of trees, presentation of trees damaged or developing abnormally
– monitoring of the condition of greenery, comparison of changes
– location of greenery against the background of real estate cadastre data, overruns.
We use advanced algorithms and programs for automatic detection and classification of objects, so we can quickly obtain quantitative data, as well as perform clustering and segmentation of objects.
POINT CLOUD CHARACTERISTICS:
| Point cloud density (LiDAR) | ~400 pts/m2 |
| Point cloud density (photogrammetry) | ~2500 pts/m2 |
| Accuracy | <3 cm |
| Data format | LAS / LAZ / E57 / TXT |
| Color palette | RGB / monochromatic / by elevation |
| Classification | ASPRS standard |
| Coordinate System | adapted to project |
ORTHOPHOTOMAP CHARACTERISTICS:
| Data format | GeoTIFF / JPEG / PDF |
| Ground Sampling Distance | od 1 cm |
| Accuracy | <3 GSD |
| Coordinate System | adapted to project |
| Color palette | 24 bit RGB |
| Compression | LZW / JPEG |
/ OTHER FROM REAL ESTATE: INVESTMENT, MANAGEMENT, SUPERVISION
- ortophotomaps: a source of spatial information
- measurement and documentation of the condition of the site before the investment
- terrain models
- vegetation map
- documentation of the current status of the investment as of a specific date
- control measurements, inventory, inspections
- aerial thermal imaging of roofs and building facades
- facade orthophotos
- photorealistic 3D models
- virtual tours
- web platform for communication with participants in the investment process with residents
- photo / video documentation
