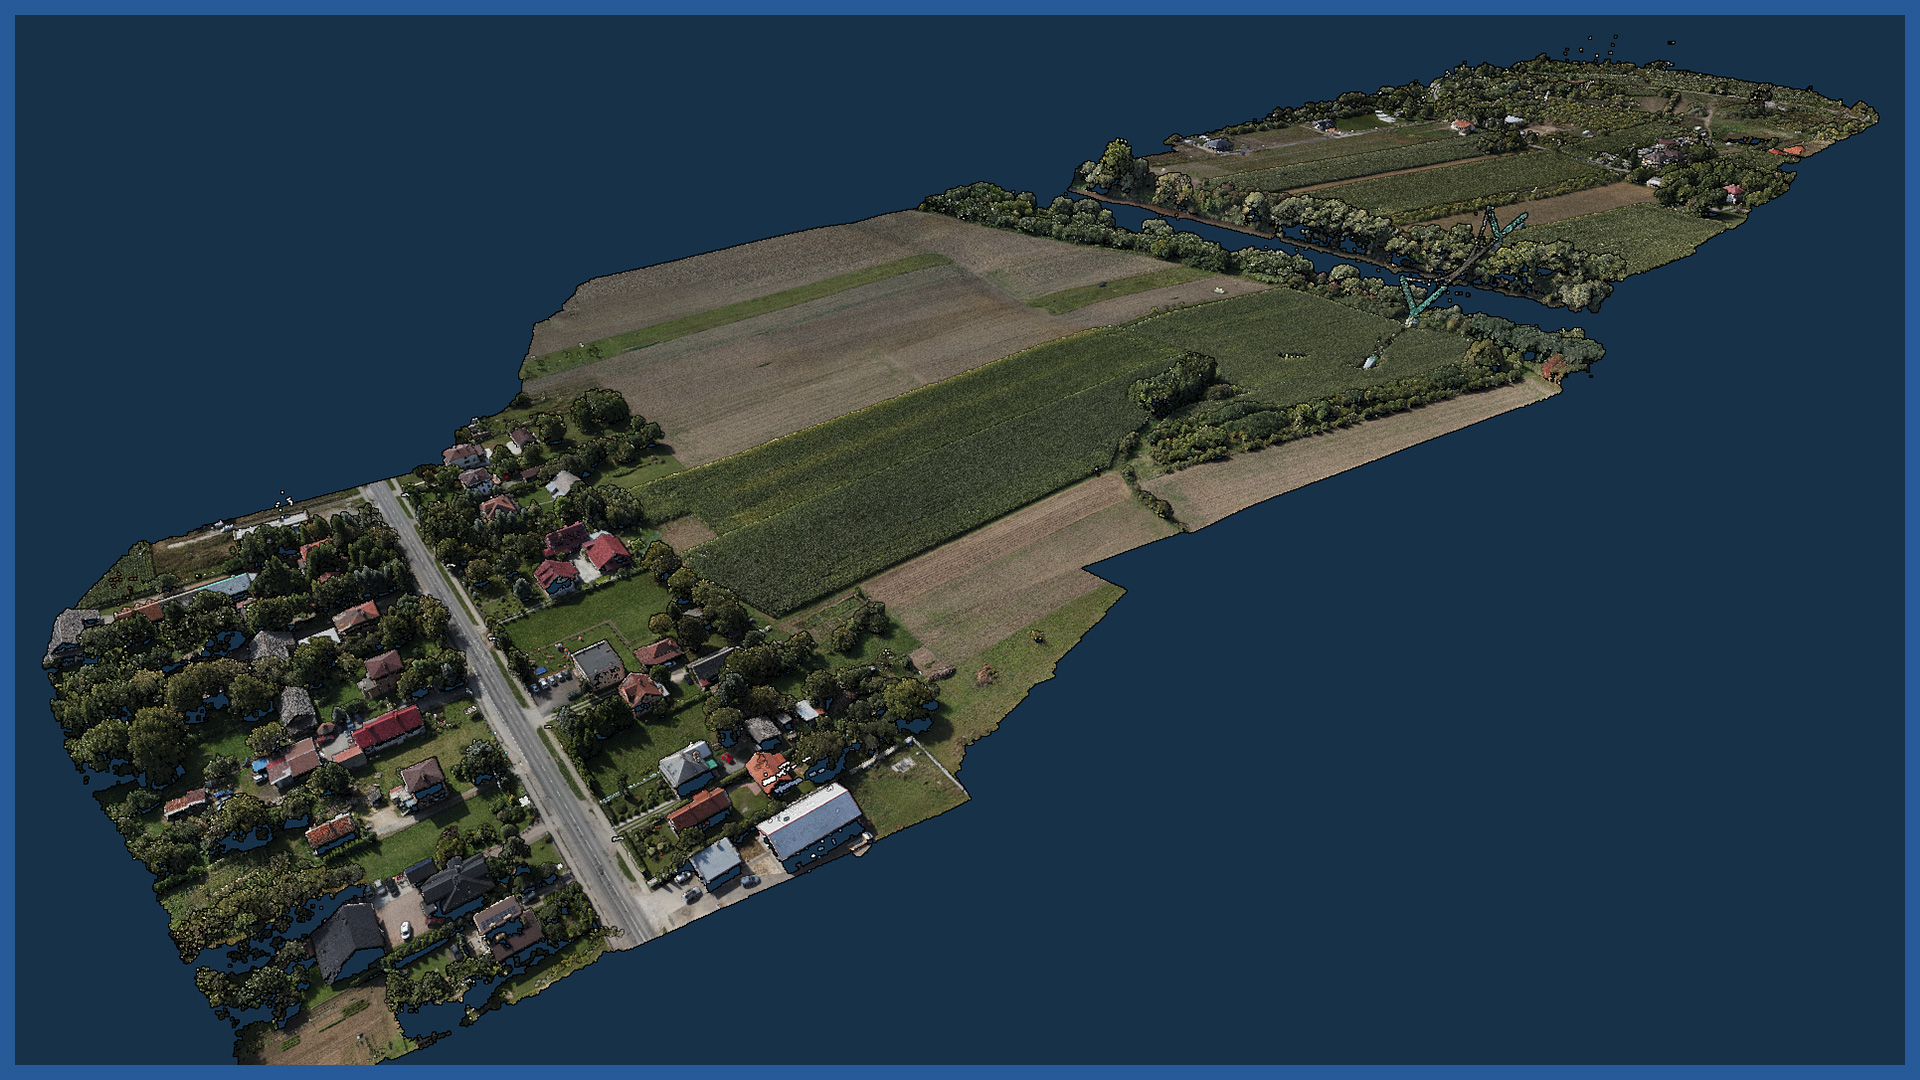
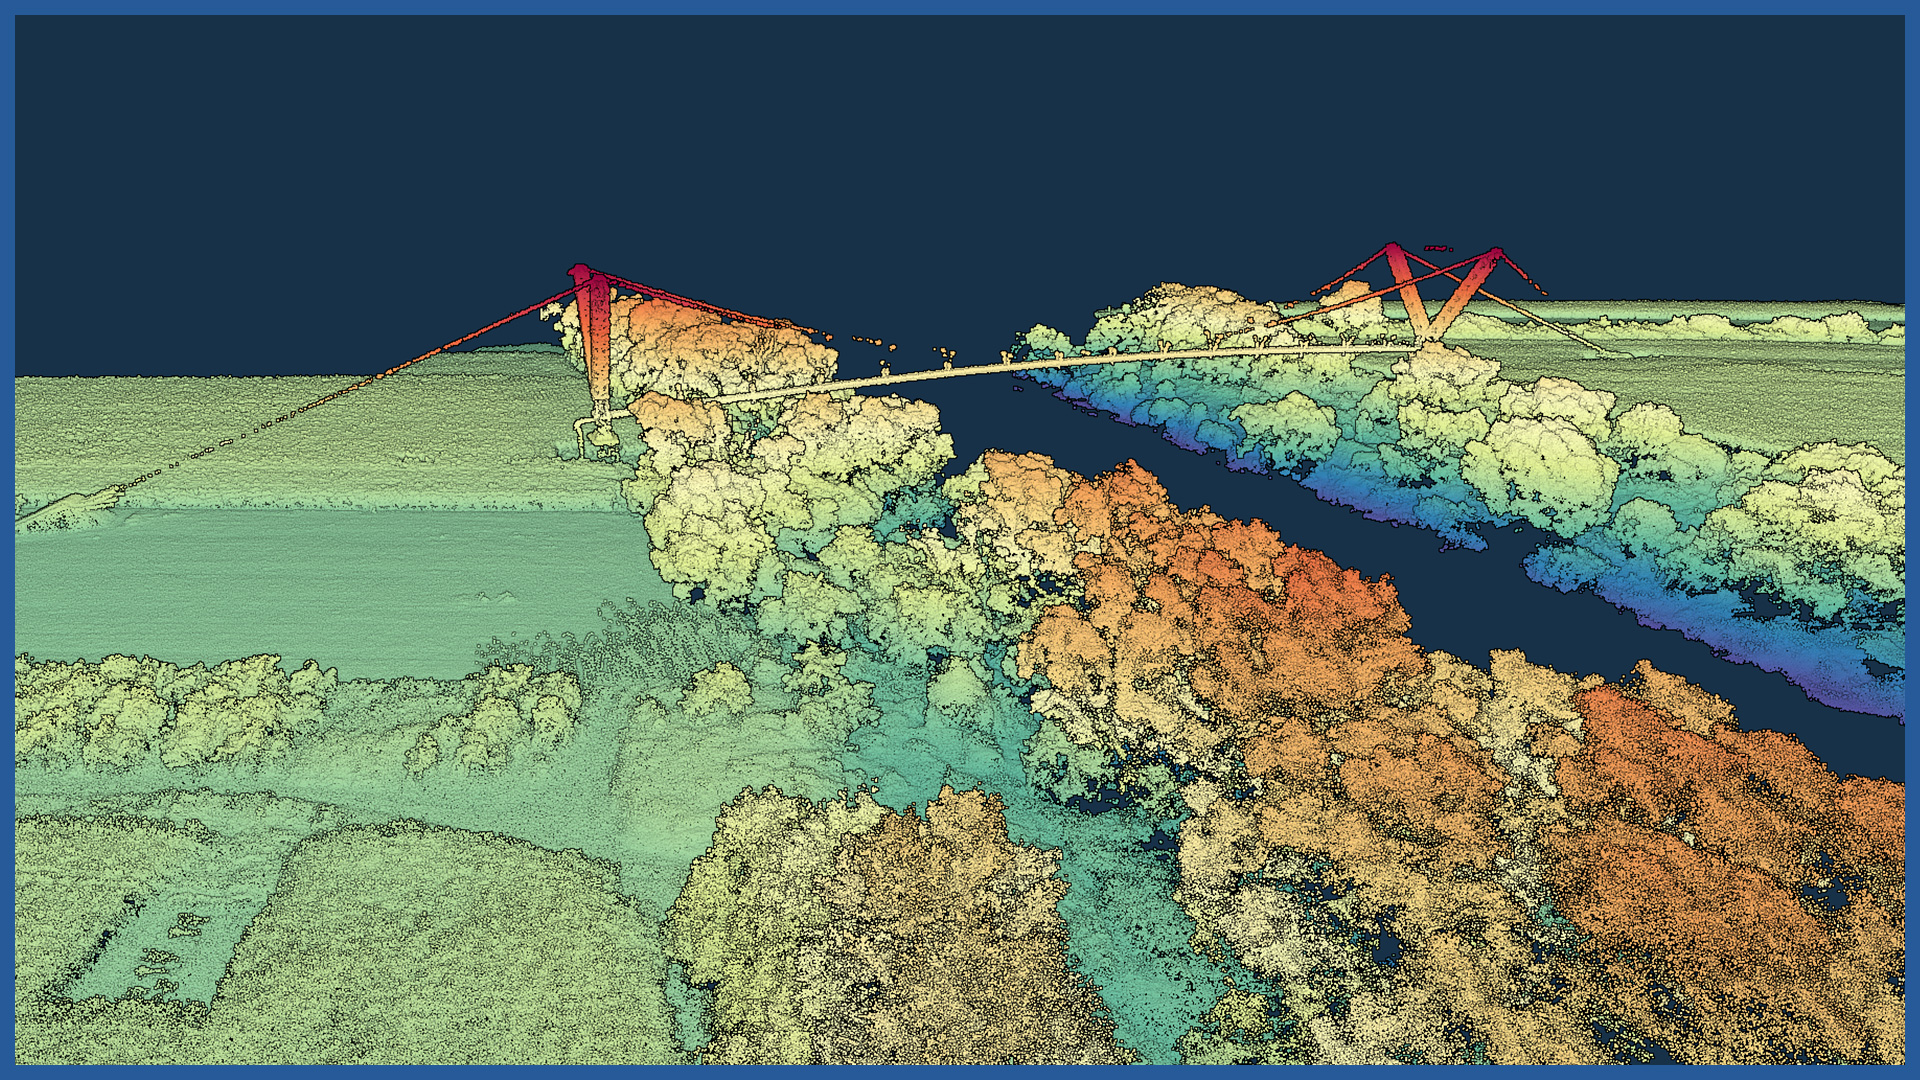
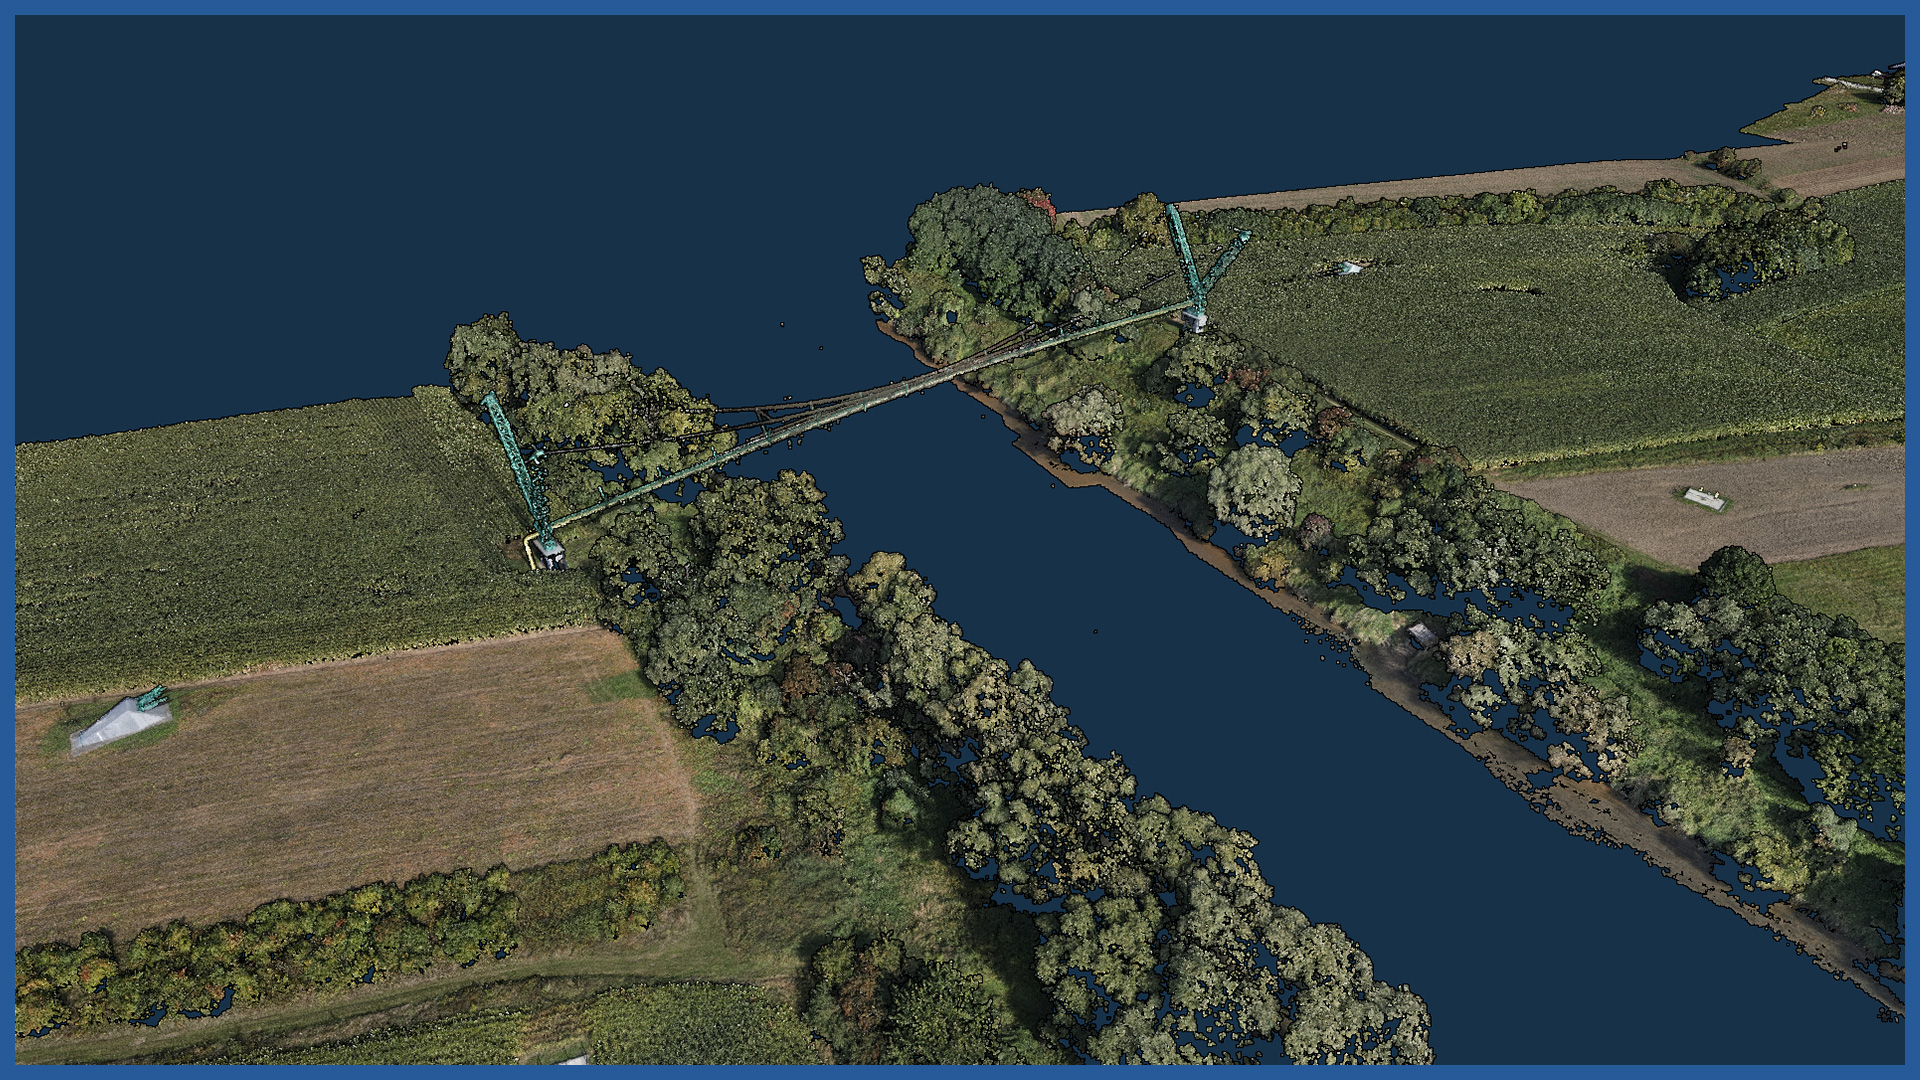
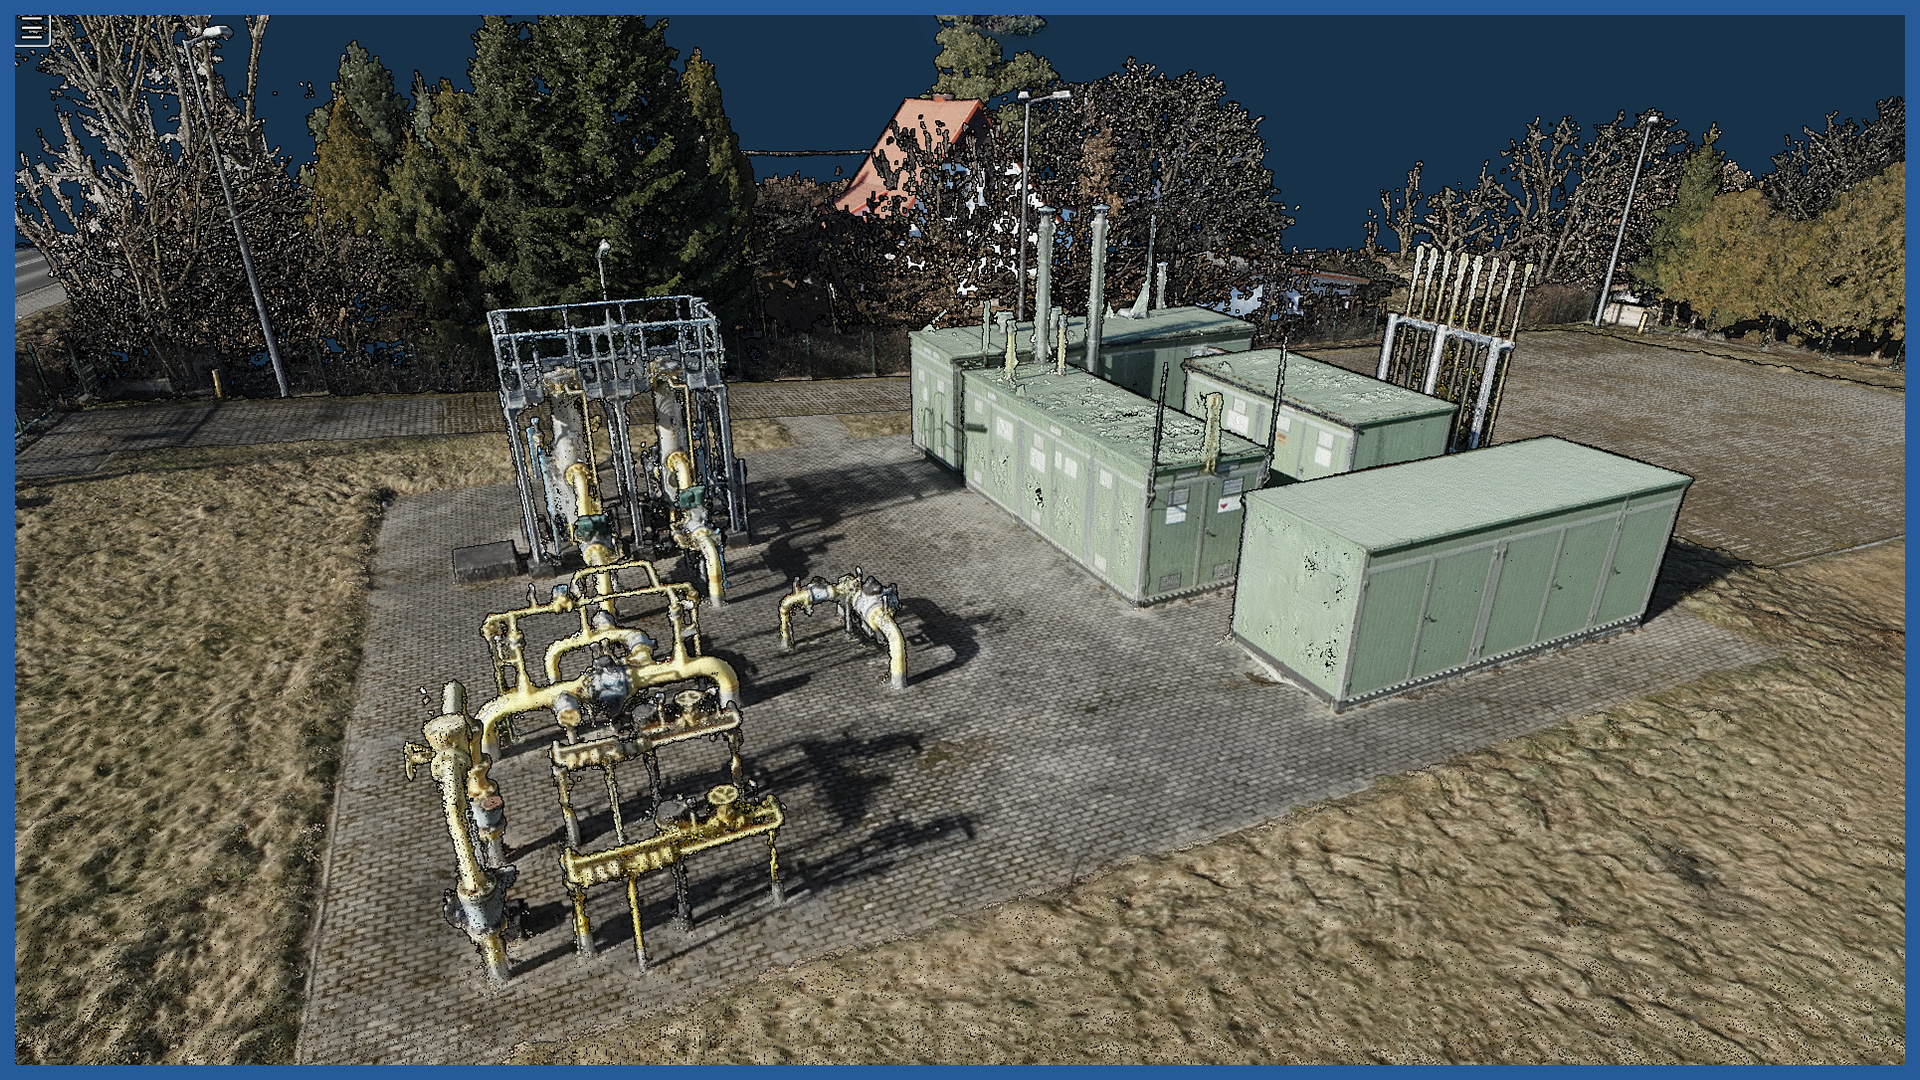
We acquire dense point clouds along the transmission belt depicting the terrain including infrastructure in detail. Measured using photogrammetric raids and airborne laser scanning, millions of points accurately represent the gas network along with its surroundings, creating a model and visualization in 3D space.
The point clouds are colored to identify individual objects and details. They can be imported into all major design support programs (for example, Revit).
The LIDAR scanning we use maps terrain that is difficult to access (river banks, reservoirs) and forested, bushy or covered with agricultural crops.
Aerial photogrammetry allows us to produce color point clouds in the RGB visible light range. The clouds obtained using this technique map the surface of the land cover along with elements projecting above it, whether natural like trees or artificial like buildings.
Aerial laser scanning makes it possible to acquire not only the land cover surface, but also after appropriate filtering of the land surface. Point clouds acquired in this way allow very fast data processing and generation of: DTM, DSM, classification into points lying on the ground, representing low/medium/high vegetation, points representing buildings, structures and engineering objects.
The point clouds, depending on the demand, can support the design, planning and supervision processes within the transmission belt area.
The clouds can be made available online, on a platform that has tools for taking basic measurements as well as generating cross sections.
POINT CLOUD CHARACTERISTICS:
| Point cloud density (LiDAR) | ~400 pts/m2 |
| Point cloud density (photogrammetry) | ~2500 pts/m2 |
| Accuracy | <3 cm |
| Data format | LAS / LAZ / E57 / TXT |
| Color palette | RGB / monochromatic / by elevation |
| Classification | ASPRS standard |
| Coordinate System | adapted to project |
/ OTHER FROM GAS NETWORKS
Select an area of interest:
