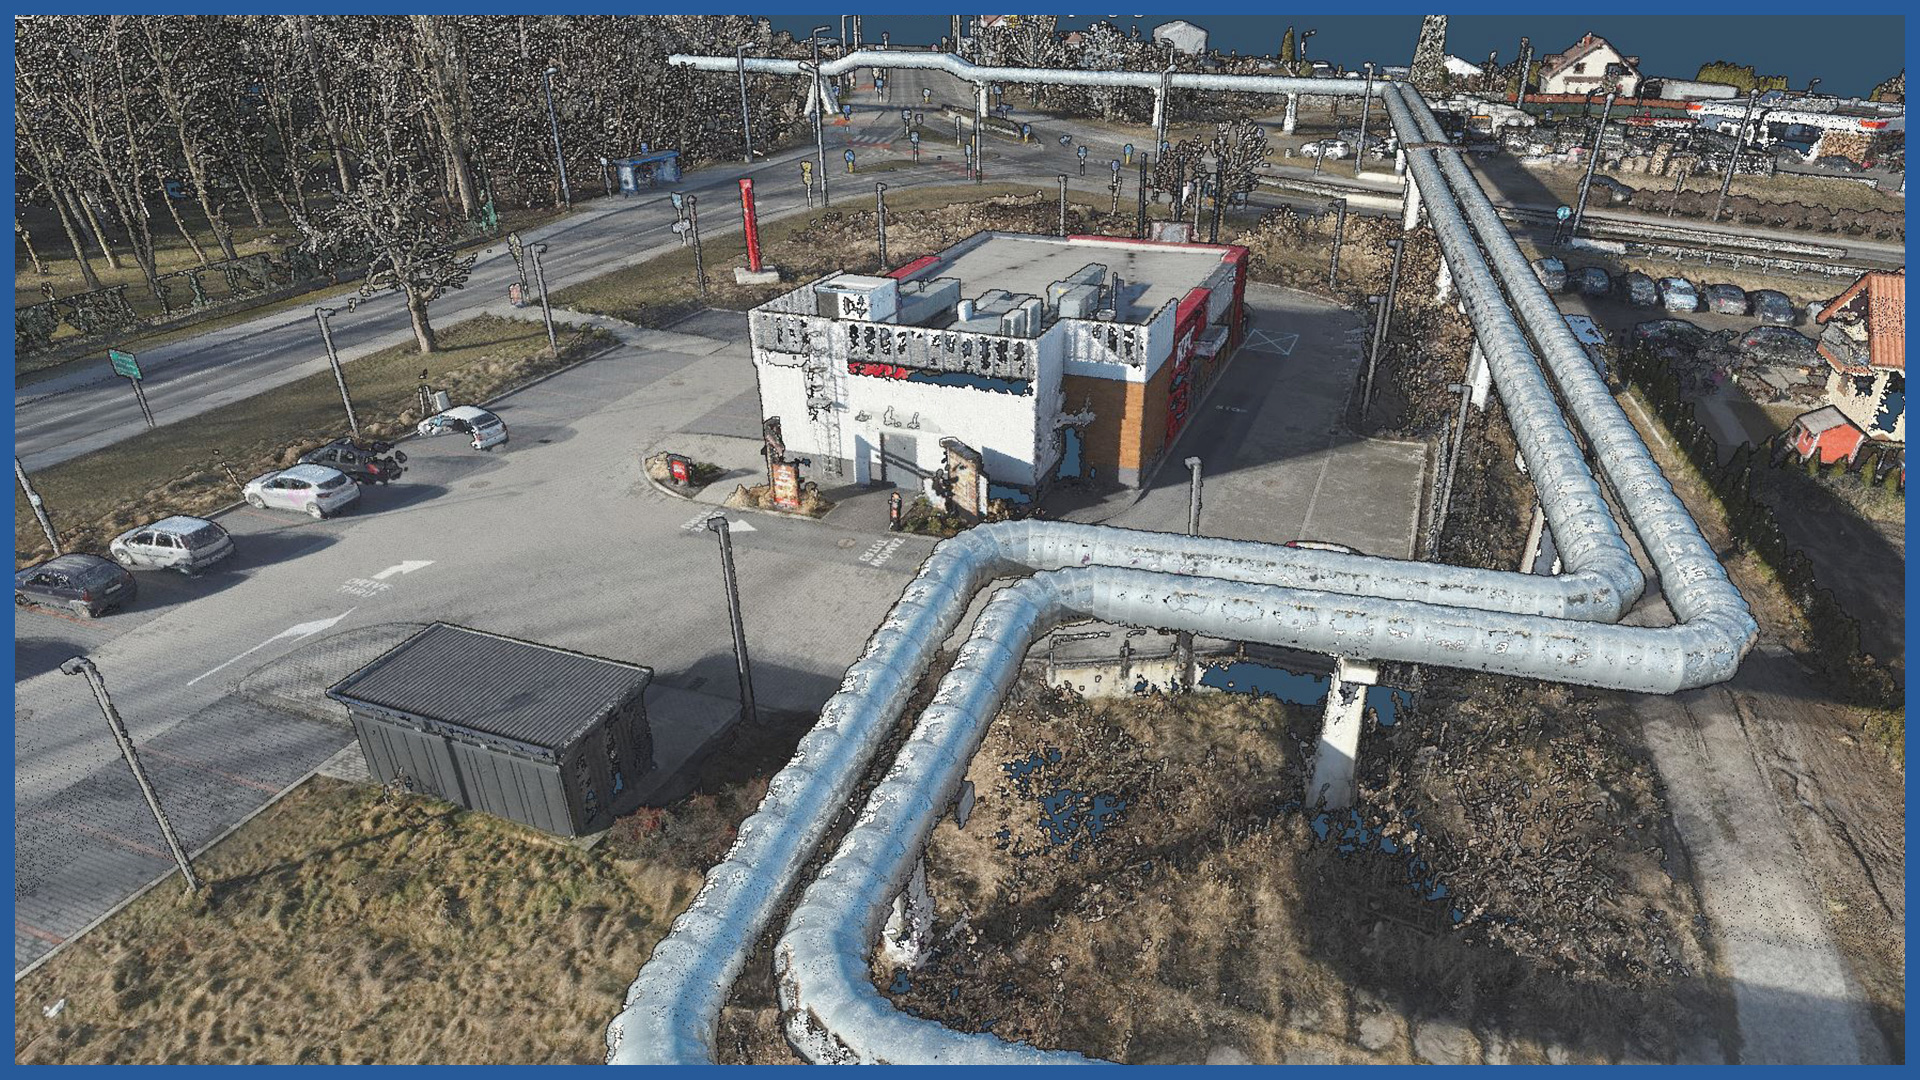
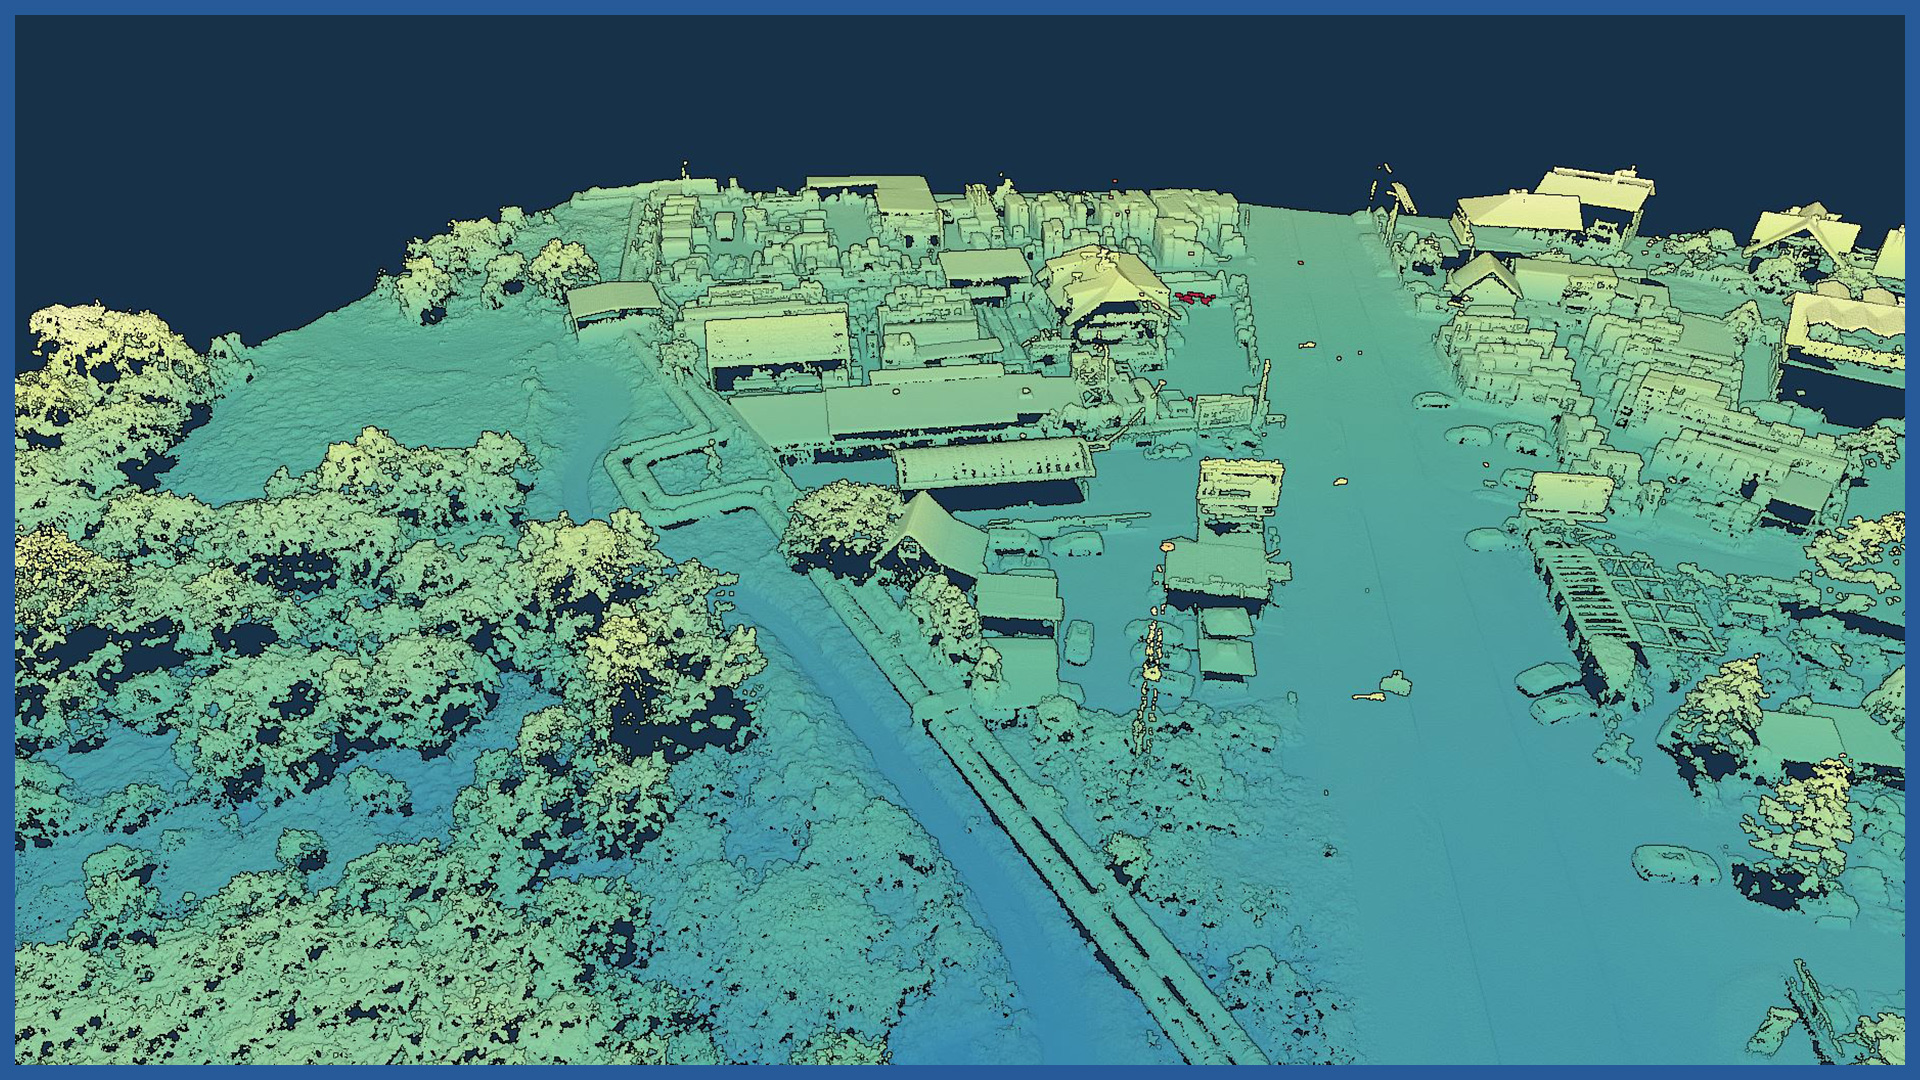
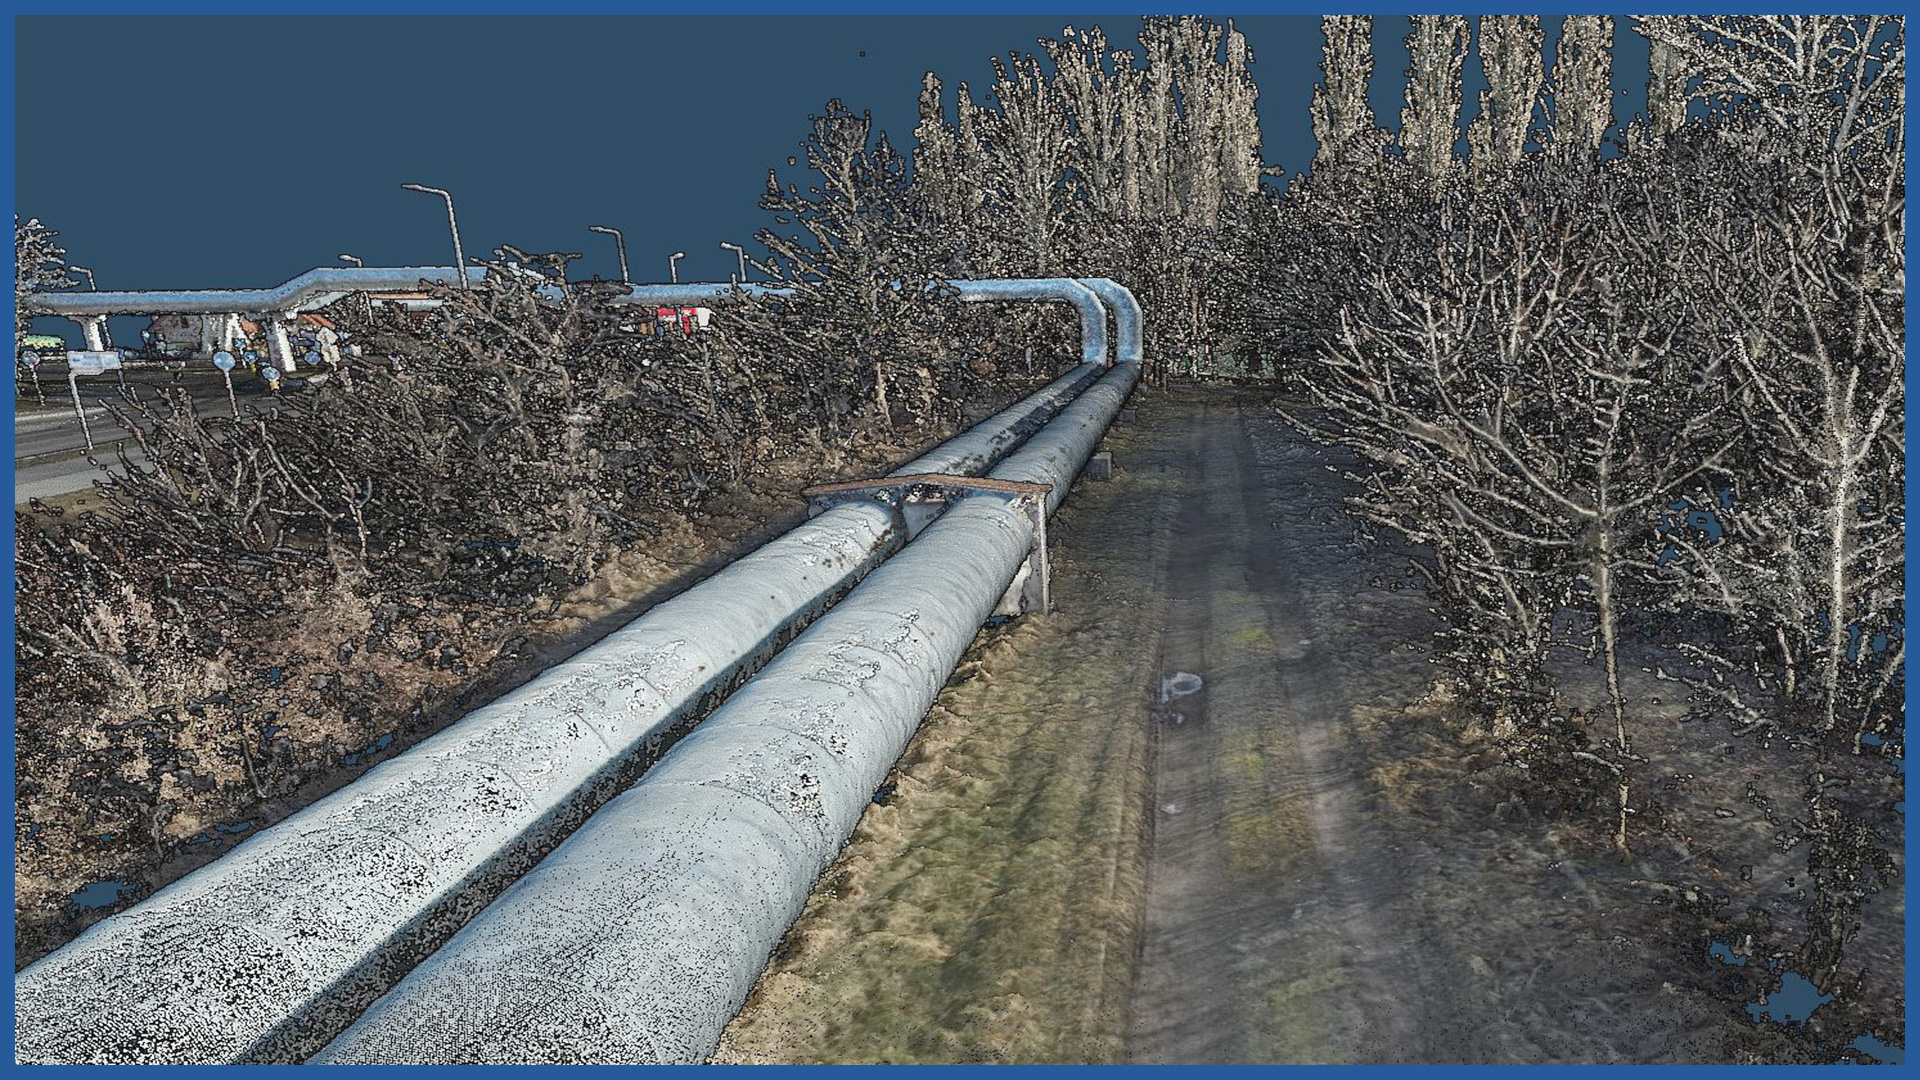
We make detailed 3D visualizations of the area and equipment within the scope of the transmission belt. Using photogrammetric raids and laser scanning, we acquire dense point clouds. On their basis we make a very detailed 3D visualization. This is a cartometric representation of the object in the appropriate coordinate system.
Measurement and processing are fast, we avoid generalization of measurement, we minimize measurement errors.
Aerial photogrammetry allows us to make color point clouds in the RGB range of visible light. The clouds acquired using this technique map the surface of the land cover along with the elements projecting above it, whether natural like trees or artificial like buildings.
Aerial laser scanning also captures the actual land surface in addition to the cover, filtering out trees, shrubs, and crops.
Point clouds acquired in this way allow very fast data processing and generation of a numerical terrain model and land cover.
We classify into points representing:
– ground
– low/medium/high vegetation
– buildings, structures and engineering objects.
The developed point clouds are used for a whole range of applications, including:
– visualizing terrain in 3D space
– supporting design, planning
– as a tool for surveillance in the area of the transmission belt
– geometric analyses (measurement of distances, heights or surfaces of objects and areas
– generation of cross and longitudinal sections and projections
– detection of object types.
POINT CLOUD CHARACTERISTICS:
| Point cloud density (LiDAR) | ~400 pts/m2 |
| Point cloud density (photogrammetry) | ~2500 pts/m2 |
| Accuracy | <3 cm |
| Data format | LAS / LAZ / E57 / TXT |
| Color palette | RGB / monochromatic / by elevation |
| Classification | ASPRS standard |
| Coordinate System | adapted to project |
/ OTHER FROM HEAT NETWORKS
Airborne thermal imaging:
- qualitative analysis of the network condition
- location of the actual course of underground heat networks
Support services for network design/ supervision/ maintenance:


